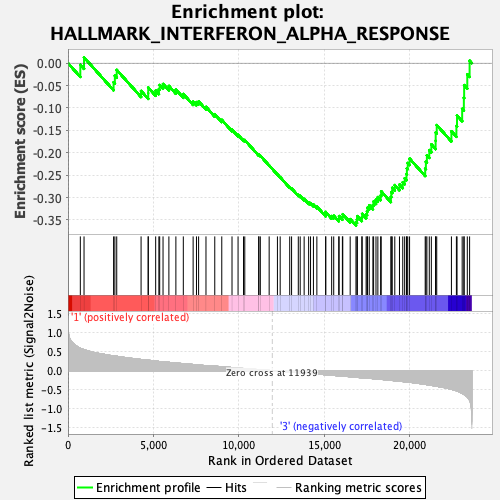
Profile of the Running ES Score & Positions of GeneSet Members on the Rank Ordered List
| Dataset | GMP.GMP.mono_Pheno.cls #Group2_versus_Group4.GMP.mono_Pheno.cls #Group2_versus_Group4_repos |
| Phenotype | GMP.mono_Pheno.cls#Group2_versus_Group4_repos |
| Upregulated in class | 3 |
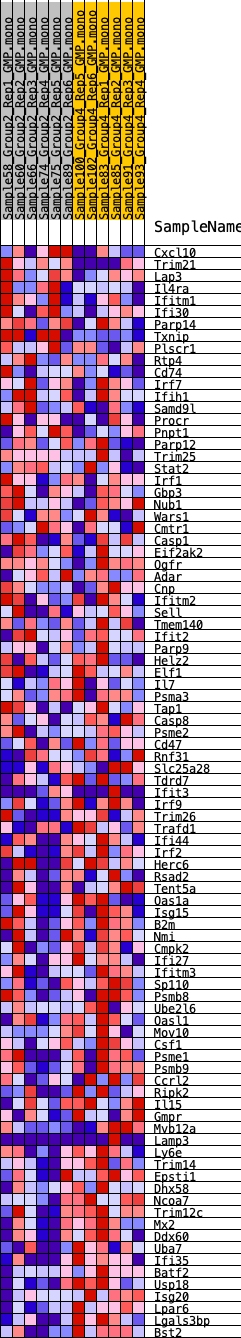
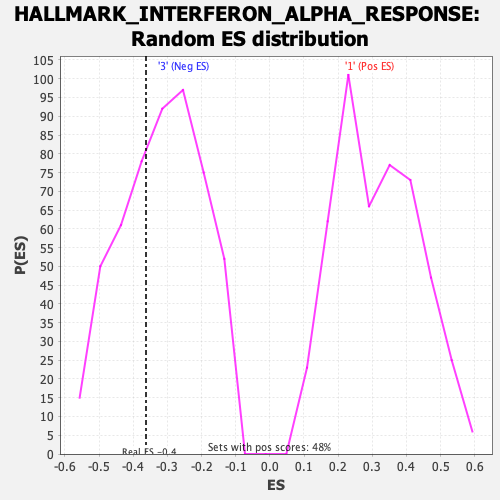
| GeneSet | HALLMARK_INTERFERON_ALPHA_RESPONSE |
| Enrichment Score (ES) | -0.36254242 |
| Normalized Enrichment Score (NES) | -1.1460948 |
| Nominal p-value | 0.37307692 |
| FDR q-value | 1.0 |
| FWER p-Value | 0.943 |
| SYMBOL | RANK IN GENE LIST | RANK METRIC SCORE | RUNNING ES | CORE ENRICHMENT | |
|---|---|---|---|---|---|
| 1 | Cxcl10 | 721 | 0.590 | -0.0035 | No |
| 2 | Trim21 | 938 | 0.556 | 0.0129 | No |
| 3 | Lap3 | 2667 | 0.391 | -0.0426 | No |
| 4 | Il4ra | 2742 | 0.386 | -0.0280 | No |
| 5 | Ifitm1 | 2851 | 0.380 | -0.0151 | No |
| 6 | Ifi30 | 4275 | 0.294 | -0.0620 | No |
| 7 | Parp14 | 4692 | 0.276 | -0.0670 | No |
| 8 | Txnip | 4694 | 0.276 | -0.0543 | No |
| 9 | Plscr1 | 5129 | 0.253 | -0.0611 | No |
| 10 | Rtp4 | 5317 | 0.243 | -0.0579 | No |
| 11 | Cd74 | 5364 | 0.241 | -0.0488 | No |
| 12 | Irf7 | 5560 | 0.231 | -0.0464 | No |
| 13 | Ifih1 | 5902 | 0.220 | -0.0508 | No |
| 14 | Samd9l | 6311 | 0.201 | -0.0589 | No |
| 15 | Procr | 6746 | 0.186 | -0.0688 | No |
| 16 | Pnpt1 | 7320 | 0.162 | -0.0857 | No |
| 17 | Parp12 | 7516 | 0.153 | -0.0869 | No |
| 18 | Trim25 | 7641 | 0.148 | -0.0854 | No |
| 19 | Stat2 | 8072 | 0.132 | -0.0976 | No |
| 20 | Irf1 | 8586 | 0.118 | -0.1140 | No |
| 21 | Gbp3 | 8996 | 0.103 | -0.1266 | No |
| 22 | Nub1 | 9595 | 0.082 | -0.1482 | No |
| 23 | Wars1 | 9949 | 0.068 | -0.1601 | No |
| 24 | Cmtr1 | 10268 | 0.057 | -0.1710 | No |
| 25 | Casp1 | 10342 | 0.054 | -0.1716 | No |
| 26 | Eif2ak2 | 11155 | 0.027 | -0.2049 | No |
| 27 | Ogfr | 11168 | 0.027 | -0.2042 | No |
| 28 | Adar | 11251 | 0.024 | -0.2066 | No |
| 29 | Cnp | 11768 | 0.006 | -0.2282 | No |
| 30 | Ifitm2 | 12252 | -0.007 | -0.2484 | No |
| 31 | Sell | 12413 | -0.013 | -0.2546 | No |
| 32 | Tmem140 | 12971 | -0.032 | -0.2768 | No |
| 33 | Ifit2 | 13080 | -0.036 | -0.2797 | No |
| 34 | Parp9 | 13473 | -0.051 | -0.2940 | No |
| 35 | Helz2 | 13584 | -0.054 | -0.2962 | No |
| 36 | Elf1 | 13815 | -0.062 | -0.3031 | No |
| 37 | Il7 | 14078 | -0.070 | -0.3110 | No |
| 38 | Psma3 | 14189 | -0.075 | -0.3123 | No |
| 39 | Tap1 | 14358 | -0.081 | -0.3157 | No |
| 40 | Casp8 | 14559 | -0.089 | -0.3201 | No |
| 41 | Psme2 | 15076 | -0.107 | -0.3371 | No |
| 42 | Cd47 | 15077 | -0.107 | -0.3322 | No |
| 43 | Rnf31 | 15425 | -0.121 | -0.3413 | No |
| 44 | Slc25a28 | 15545 | -0.126 | -0.3406 | No |
| 45 | Tdrd7 | 15840 | -0.136 | -0.3469 | No |
| 46 | Ifit3 | 15859 | -0.137 | -0.3413 | No |
| 47 | Irf9 | 16052 | -0.144 | -0.3429 | No |
| 48 | Trim26 | 16075 | -0.144 | -0.3372 | No |
| 49 | Trafd1 | 16508 | -0.160 | -0.3482 | No |
| 50 | Ifi44 | 16847 | -0.174 | -0.3545 | Yes |
| 51 | Irf2 | 16906 | -0.177 | -0.3488 | Yes |
| 52 | Herc6 | 16927 | -0.179 | -0.3415 | Yes |
| 53 | Rsad2 | 17189 | -0.186 | -0.3440 | Yes |
| 54 | Tent5a | 17210 | -0.186 | -0.3363 | Yes |
| 55 | Oas1a | 17441 | -0.195 | -0.3371 | Yes |
| 56 | Isg15 | 17495 | -0.197 | -0.3303 | Yes |
| 57 | B2m | 17524 | -0.198 | -0.3224 | Yes |
| 58 | Nmi | 17624 | -0.202 | -0.3173 | Yes |
| 59 | Cmpk2 | 17837 | -0.211 | -0.3166 | Yes |
| 60 | Ifi27 | 17879 | -0.212 | -0.3086 | Yes |
| 61 | Ifitm3 | 18018 | -0.217 | -0.3045 | Yes |
| 62 | Sp110 | 18128 | -0.221 | -0.2989 | Yes |
| 63 | Psmb8 | 18290 | -0.228 | -0.2953 | Yes |
| 64 | Ube2l6 | 18322 | -0.230 | -0.2860 | Yes |
| 65 | Oasl1 | 18889 | -0.254 | -0.2984 | Yes |
| 66 | Mov10 | 18915 | -0.256 | -0.2877 | Yes |
| 67 | Csf1 | 18969 | -0.258 | -0.2781 | Yes |
| 68 | Psme1 | 19118 | -0.267 | -0.2721 | Yes |
| 69 | Psmb9 | 19392 | -0.279 | -0.2709 | Yes |
| 70 | Ccrl2 | 19584 | -0.287 | -0.2658 | Yes |
| 71 | Ripk2 | 19696 | -0.294 | -0.2570 | Yes |
| 72 | Il15 | 19802 | -0.301 | -0.2477 | Yes |
| 73 | Gmpr | 19826 | -0.302 | -0.2347 | Yes |
| 74 | Mvb12a | 19877 | -0.305 | -0.2228 | Yes |
| 75 | Lamp3 | 19983 | -0.310 | -0.2130 | Yes |
| 76 | Ly6e | 20897 | -0.362 | -0.2352 | Yes |
| 77 | Trim14 | 20937 | -0.365 | -0.2201 | Yes |
| 78 | Epsti1 | 20996 | -0.369 | -0.2056 | Yes |
| 79 | Dhx58 | 21136 | -0.379 | -0.1941 | Yes |
| 80 | Ncoa7 | 21256 | -0.388 | -0.1813 | Yes |
| 81 | Trim12c | 21506 | -0.407 | -0.1732 | Yes |
| 82 | Mx2 | 21511 | -0.407 | -0.1546 | Yes |
| 83 | Ddx60 | 21572 | -0.412 | -0.1382 | Yes |
| 84 | Uba7 | 22431 | -0.493 | -0.1520 | Yes |
| 85 | Ifi35 | 22722 | -0.530 | -0.1400 | Yes |
| 86 | Batf2 | 22759 | -0.538 | -0.1167 | Yes |
| 87 | Usp18 | 23060 | -0.600 | -0.1019 | Yes |
| 88 | Isg20 | 23159 | -0.624 | -0.0773 | Yes |
| 89 | Lpar6 | 23176 | -0.631 | -0.0490 | Yes |
| 90 | Lgals3bp | 23360 | -0.692 | -0.0249 | Yes |
| 91 | Bst2 | 23495 | -0.786 | 0.0055 | Yes |