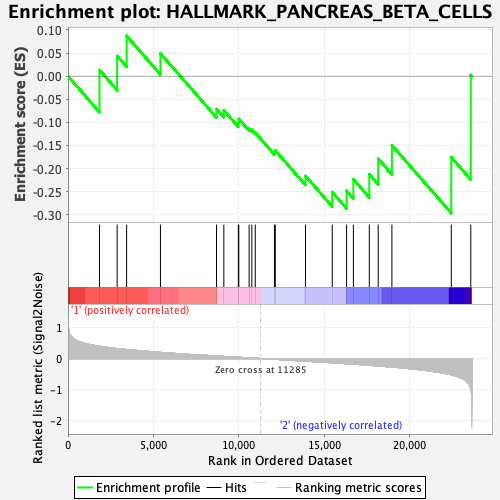
Profile of the Running ES Score & Positions of GeneSet Members on the Rank Ordered List
| Dataset | GMP.GMP.mono_Pheno.cls #Group2_versus_Group3.GMP.mono_Pheno.cls #Group2_versus_Group3_repos |
| Phenotype | GMP.mono_Pheno.cls#Group2_versus_Group3_repos |
| Upregulated in class | 2 |
| GeneSet | HALLMARK_PANCREAS_BETA_CELLS |
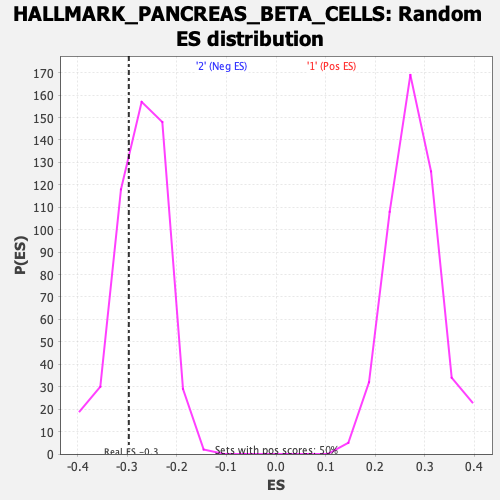
| Enrichment Score (ES) | -0.2966754 |
| Normalized Enrichment Score (NES) | -1.0893768 |
| Nominal p-value | 0.29025844 |
| FDR q-value | 0.9033176 |
| FWER p-Value | 0.972 |
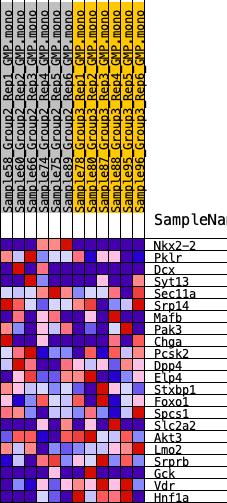
| SYMBOL | RANK IN GENE LIST | RANK METRIC SCORE | RUNNING ES | CORE ENRICHMENT | |
|---|---|---|---|---|---|
| 1 | Nkx2-2 | 1842 | 0.394 | 0.0133 | No |
| 2 | Pklr | 2874 | 0.320 | 0.0437 | No |
| 3 | Dcx | 3430 | 0.290 | 0.0873 | No |
| 4 | Syt13 | 5408 | 0.197 | 0.0492 | No |
| 5 | Sec11a | 8689 | 0.080 | -0.0711 | No |
| 6 | Srp14 | 9117 | 0.067 | -0.0738 | No |
| 7 | Mafb | 9964 | 0.040 | -0.1004 | No |
| 8 | Pak3 | 9992 | 0.039 | -0.0926 | No |
| 9 | Chga | 10597 | 0.021 | -0.1133 | No |
| 10 | Pcsk2 | 10755 | 0.016 | -0.1163 | No |
| 11 | Dpp4 | 10955 | 0.010 | -0.1224 | No |
| 12 | Elp4 | 12077 | -0.023 | -0.1645 | No |
| 13 | Stxbp1 | 12127 | -0.025 | -0.1608 | No |
| 14 | Foxo1 | 13894 | -0.084 | -0.2162 | No |
| 15 | Spcs1 | 15459 | -0.135 | -0.2511 | Yes |
| 16 | Slc2a2 | 16297 | -0.166 | -0.2481 | Yes |
| 17 | Akt3 | 16695 | -0.180 | -0.2233 | Yes |
| 18 | Lmo2 | 17627 | -0.218 | -0.2123 | Yes |
| 19 | Srprb | 18147 | -0.240 | -0.1787 | Yes |
| 20 | Gck | 18949 | -0.273 | -0.1495 | Yes |
| 21 | Vdr | 22423 | -0.523 | -0.1755 | Yes |
| 22 | Hnf1a | 23564 | -0.977 | 0.0025 | Yes |