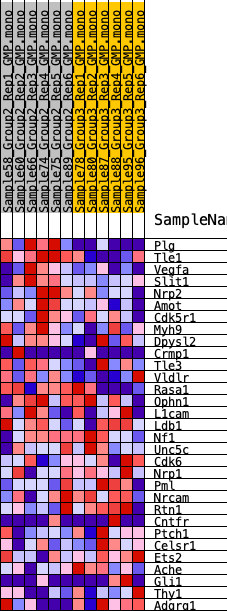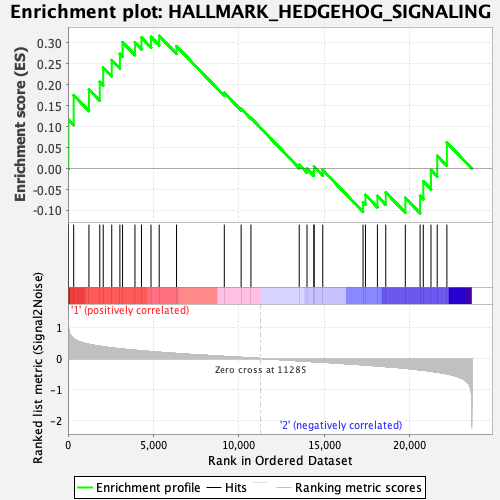
Profile of the Running ES Score & Positions of GeneSet Members on the Rank Ordered List
| Dataset | GMP.GMP.mono_Pheno.cls #Group2_versus_Group3.GMP.mono_Pheno.cls #Group2_versus_Group3_repos |
| Phenotype | GMP.mono_Pheno.cls#Group2_versus_Group3_repos |
| Upregulated in class | 1 |
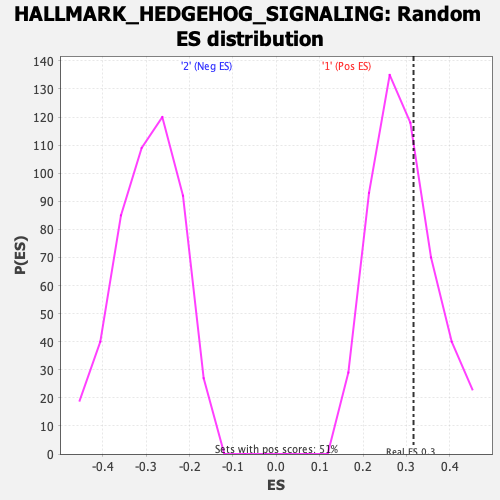
| GeneSet | HALLMARK_HEDGEHOG_SIGNALING |
| Enrichment Score (ES) | 0.31637803 |
| Normalized Enrichment Score (NES) | 1.0886384 |
| Nominal p-value | 0.3503937 |
| FDR q-value | 0.95423555 |
| FWER p-Value | 0.975 |
| SYMBOL | RANK IN GENE LIST | RANK METRIC SCORE | RUNNING ES | CORE ENRICHMENT | |
|---|---|---|---|---|---|
| 1 | Plg | 24 | 1.039 | 0.1165 | Yes |
| 2 | Tle1 | 332 | 0.631 | 0.1749 | Yes |
| 3 | Vegfa | 1224 | 0.456 | 0.1888 | Yes |
| 4 | Slit1 | 1859 | 0.394 | 0.2065 | Yes |
| 5 | Nrp2 | 2060 | 0.379 | 0.2408 | Yes |
| 6 | Amot | 2559 | 0.343 | 0.2585 | Yes |
| 7 | Cdk5r1 | 3036 | 0.310 | 0.2734 | Yes |
| 8 | Myh9 | 3191 | 0.303 | 0.3012 | Yes |
| 9 | Dpysl2 | 3917 | 0.266 | 0.3006 | Yes |
| 10 | Crmp1 | 4298 | 0.246 | 0.3123 | Yes |
| 11 | Tle3 | 4856 | 0.223 | 0.3139 | Yes |
| 12 | Vldlr | 5335 | 0.201 | 0.3164 | Yes |
| 13 | Rasa1 | 6349 | 0.161 | 0.2916 | No |
| 14 | Ophn1 | 9144 | 0.066 | 0.1806 | No |
| 15 | L1cam | 10129 | 0.035 | 0.1429 | No |
| 16 | Ldb1 | 10702 | 0.018 | 0.1207 | No |
| 17 | Nf1 | 13528 | -0.072 | 0.0090 | No |
| 18 | Unc5c | 13983 | -0.086 | -0.0004 | No |
| 19 | Cdk6 | 14386 | -0.100 | -0.0061 | No |
| 20 | Nrp1 | 14397 | -0.100 | 0.0048 | No |
| 21 | Pml | 14904 | -0.117 | -0.0035 | No |
| 22 | Nrcam | 17260 | -0.202 | -0.0804 | No |
| 23 | Rtn1 | 17403 | -0.209 | -0.0628 | No |
| 24 | Cntfr | 18101 | -0.238 | -0.0654 | No |
| 25 | Ptch1 | 18590 | -0.259 | -0.0568 | No |
| 26 | Celsr1 | 19734 | -0.313 | -0.0698 | No |
| 27 | Ets2 | 20599 | -0.364 | -0.0652 | No |
| 28 | Ache | 20786 | -0.376 | -0.0306 | No |
| 29 | Gli1 | 21235 | -0.406 | -0.0037 | No |
| 30 | Thy1 | 21600 | -0.437 | 0.0302 | No |
| 31 | Adgrg1 | 22165 | -0.491 | 0.0618 | No |