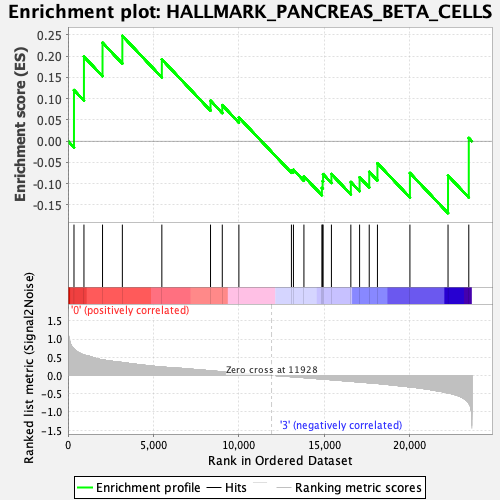
Profile of the Running ES Score & Positions of GeneSet Members on the Rank Ordered List
| Dataset | GMP.GMP.mono_Pheno.cls #Group1_versus_Group4.GMP.mono_Pheno.cls #Group1_versus_Group4_repos |
| Phenotype | GMP.mono_Pheno.cls#Group1_versus_Group4_repos |
| Upregulated in class | 0 |
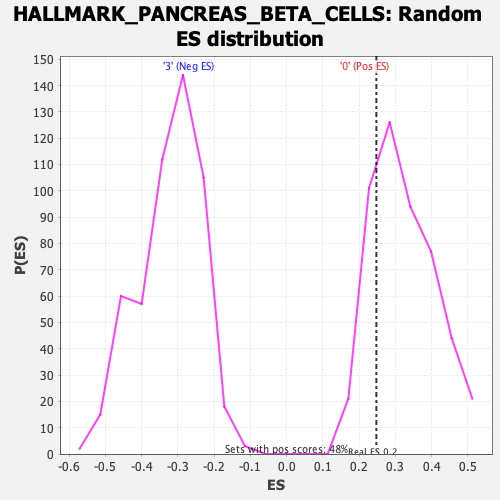
| GeneSet | HALLMARK_PANCREAS_BETA_CELLS |
| Enrichment Score (ES) | 0.24771814 |
| Normalized Enrichment Score (NES) | 0.77187175 |
| Nominal p-value | 0.77272725 |
| FDR q-value | 0.98400056 |
| FWER p-Value | 1.0 |
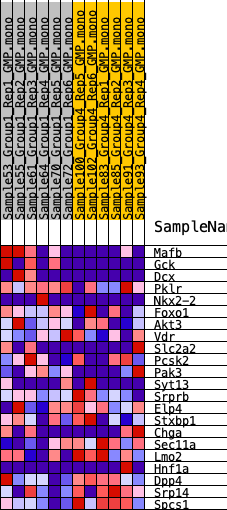
| SYMBOL | RANK IN GENE LIST | RANK METRIC SCORE | RUNNING ES | CORE ENRICHMENT | |
|---|---|---|---|---|---|
| 1 | Mafb | 350 | 0.729 | 0.1202 | Yes |
| 2 | Gck | 933 | 0.558 | 0.1989 | Yes |
| 3 | Dcx | 2020 | 0.425 | 0.2316 | Yes |
| 4 | Pklr | 3180 | 0.352 | 0.2477 | Yes |
| 5 | Nkx2-2 | 5490 | 0.230 | 0.1925 | No |
| 6 | Foxo1 | 8338 | 0.126 | 0.0953 | No |
| 7 | Akt3 | 9026 | 0.100 | 0.0847 | No |
| 8 | Vdr | 9997 | 0.066 | 0.0559 | No |
| 9 | Slc2a2 | 13071 | -0.030 | -0.0687 | No |
| 10 | Pcsk2 | 13189 | -0.035 | -0.0672 | No |
| 11 | Pak3 | 13802 | -0.056 | -0.0827 | No |
| 12 | Syt13 | 14853 | -0.093 | -0.1100 | No |
| 13 | Srprb | 14896 | -0.095 | -0.0942 | No |
| 14 | Elp4 | 14922 | -0.095 | -0.0776 | No |
| 15 | Stxbp1 | 15411 | -0.114 | -0.0772 | No |
| 16 | Chga | 16547 | -0.158 | -0.0960 | No |
| 17 | Sec11a | 17059 | -0.176 | -0.0850 | No |
| 18 | Lmo2 | 17623 | -0.198 | -0.0722 | No |
| 19 | Hnf1a | 18103 | -0.219 | -0.0519 | No |
| 20 | Dpp4 | 20003 | -0.311 | -0.0748 | No |
| 21 | Srp14 | 22233 | -0.476 | -0.0811 | No |
| 22 | Spcs1 | 23447 | -0.755 | 0.0075 | No |