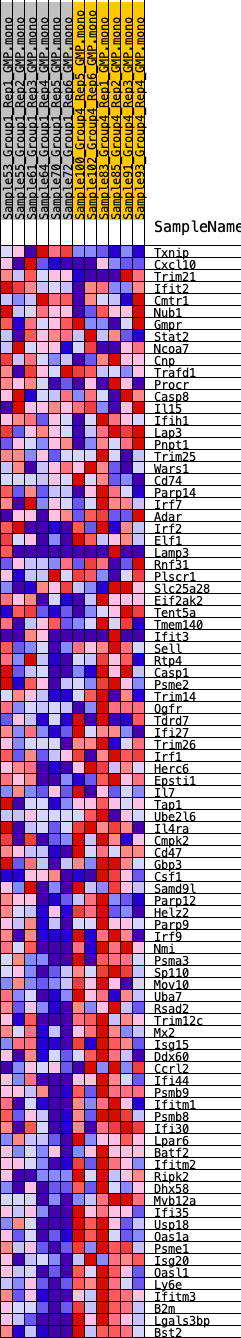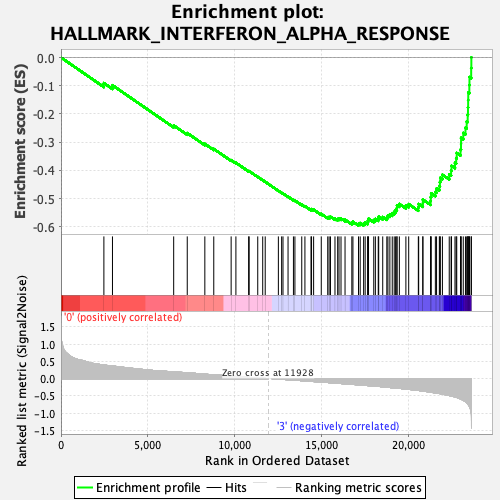
Profile of the Running ES Score & Positions of GeneSet Members on the Rank Ordered List
| Dataset | GMP.GMP.mono_Pheno.cls #Group1_versus_Group4.GMP.mono_Pheno.cls #Group1_versus_Group4_repos |
| Phenotype | GMP.mono_Pheno.cls#Group1_versus_Group4_repos |
| Upregulated in class | 3 |
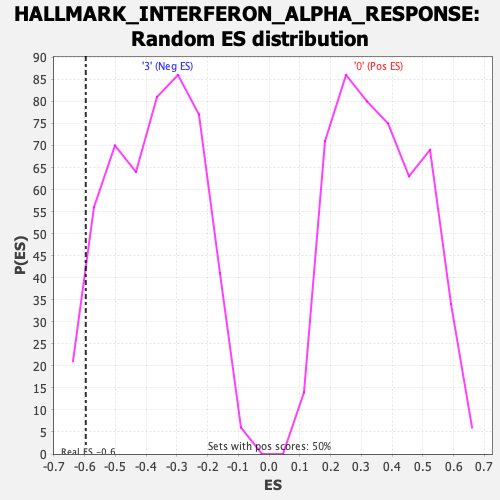
| GeneSet | HALLMARK_INTERFERON_ALPHA_RESPONSE |
| Enrichment Score (ES) | -0.596087 |
| Normalized Enrichment Score (NES) | -1.5969123 |
| Nominal p-value | 0.047808766 |
| FDR q-value | 0.10983926 |
| FWER p-Value | 0.232 |
| SYMBOL | RANK IN GENE LIST | RANK METRIC SCORE | RUNNING ES | CORE ENRICHMENT | |
|---|---|---|---|---|---|
| 1 | Txnip | 2468 | 0.392 | -0.0907 | No |
| 2 | Cxcl10 | 2962 | 0.367 | -0.0983 | No |
| 3 | Trim21 | 6485 | 0.195 | -0.2410 | No |
| 4 | Ifit2 | 7266 | 0.168 | -0.2680 | No |
| 5 | Cmtr1 | 8278 | 0.129 | -0.3063 | No |
| 6 | Nub1 | 8792 | 0.109 | -0.3242 | No |
| 7 | Gmpr | 9792 | 0.074 | -0.3640 | No |
| 8 | Stat2 | 10066 | 0.064 | -0.3733 | No |
| 9 | Ncoa7 | 10799 | 0.037 | -0.4030 | No |
| 10 | Cnp | 10828 | 0.036 | -0.4029 | No |
| 11 | Trafd1 | 11323 | 0.020 | -0.4232 | No |
| 12 | Procr | 11609 | 0.011 | -0.4349 | No |
| 13 | Casp8 | 11753 | 0.006 | -0.4408 | No |
| 14 | Il15 | 12510 | -0.011 | -0.4725 | No |
| 15 | Ifih1 | 12698 | -0.018 | -0.4798 | No |
| 16 | Lap3 | 12776 | -0.020 | -0.4823 | No |
| 17 | Pnpt1 | 13067 | -0.030 | -0.4936 | No |
| 18 | Trim25 | 13377 | -0.041 | -0.5052 | No |
| 19 | Wars1 | 13462 | -0.045 | -0.5072 | No |
| 20 | Cd74 | 13856 | -0.058 | -0.5218 | No |
| 21 | Parp14 | 14038 | -0.064 | -0.5271 | No |
| 22 | Irf7 | 14388 | -0.078 | -0.5392 | No |
| 23 | Adar | 14419 | -0.079 | -0.5376 | No |
| 24 | Irf2 | 14539 | -0.083 | -0.5396 | No |
| 25 | Elf1 | 14979 | -0.098 | -0.5547 | No |
| 26 | Lamp3 | 15351 | -0.112 | -0.5665 | No |
| 27 | Rnf31 | 15430 | -0.114 | -0.5656 | No |
| 28 | Plscr1 | 15509 | -0.117 | -0.5647 | No |
| 29 | Slc25a28 | 15768 | -0.127 | -0.5711 | No |
| 30 | Eif2ak2 | 15923 | -0.134 | -0.5728 | No |
| 31 | Tent5a | 15999 | -0.137 | -0.5710 | No |
| 32 | Tmem140 | 16115 | -0.141 | -0.5708 | No |
| 33 | Ifit3 | 16347 | -0.150 | -0.5752 | No |
| 34 | Sell | 16738 | -0.164 | -0.5858 | No |
| 35 | Rtp4 | 16801 | -0.166 | -0.5824 | No |
| 36 | Casp1 | 17123 | -0.178 | -0.5896 | Yes |
| 37 | Psme2 | 17219 | -0.182 | -0.5871 | Yes |
| 38 | Trim14 | 17417 | -0.190 | -0.5886 | Yes |
| 39 | Ogfr | 17505 | -0.194 | -0.5853 | Yes |
| 40 | Tdrd7 | 17647 | -0.200 | -0.5840 | Yes |
| 41 | Ifi27 | 17667 | -0.201 | -0.5776 | Yes |
| 42 | Trim26 | 17699 | -0.202 | -0.5716 | Yes |
| 43 | Irf1 | 18000 | -0.215 | -0.5766 | Yes |
| 44 | Herc6 | 18092 | -0.218 | -0.5725 | Yes |
| 45 | Epsti1 | 18258 | -0.223 | -0.5715 | Yes |
| 46 | Il7 | 18284 | -0.224 | -0.5644 | Yes |
| 47 | Tap1 | 18516 | -0.234 | -0.5657 | Yes |
| 48 | Ube2l6 | 18752 | -0.246 | -0.5668 | Yes |
| 49 | Il4ra | 18815 | -0.250 | -0.5604 | Yes |
| 50 | Cmpk2 | 18927 | -0.256 | -0.5559 | Yes |
| 51 | Cd47 | 19064 | -0.264 | -0.5521 | Yes |
| 52 | Gbp3 | 19177 | -0.269 | -0.5471 | Yes |
| 53 | Csf1 | 19257 | -0.272 | -0.5406 | Yes |
| 54 | Samd9l | 19330 | -0.276 | -0.5337 | Yes |
| 55 | Parp12 | 19339 | -0.276 | -0.5240 | Yes |
| 56 | Helz2 | 19473 | -0.284 | -0.5194 | Yes |
| 57 | Parp9 | 19849 | -0.302 | -0.5244 | Yes |
| 58 | Irf9 | 20011 | -0.311 | -0.5200 | Yes |
| 59 | Nmi | 20565 | -0.341 | -0.5312 | Yes |
| 60 | Psma3 | 20585 | -0.342 | -0.5196 | Yes |
| 61 | Sp110 | 20824 | -0.358 | -0.5168 | Yes |
| 62 | Mov10 | 20827 | -0.358 | -0.5039 | Yes |
| 63 | Uba7 | 21271 | -0.390 | -0.5086 | Yes |
| 64 | Rsad2 | 21281 | -0.391 | -0.4948 | Yes |
| 65 | Trim12c | 21304 | -0.393 | -0.4816 | Yes |
| 66 | Mx2 | 21545 | -0.413 | -0.4768 | Yes |
| 67 | Isg15 | 21614 | -0.419 | -0.4645 | Yes |
| 68 | Ddx60 | 21775 | -0.428 | -0.4558 | Yes |
| 69 | Ccrl2 | 21807 | -0.432 | -0.4415 | Yes |
| 70 | Ifi44 | 21828 | -0.434 | -0.4267 | Yes |
| 71 | Psmb9 | 21951 | -0.447 | -0.4157 | Yes |
| 72 | Ifitm1 | 22344 | -0.488 | -0.4147 | Yes |
| 73 | Psmb8 | 22451 | -0.498 | -0.4012 | Yes |
| 74 | Ifi30 | 22475 | -0.501 | -0.3840 | Yes |
| 75 | Lpar6 | 22675 | -0.528 | -0.3734 | Yes |
| 76 | Batf2 | 22744 | -0.537 | -0.3568 | Yes |
| 77 | Ifitm2 | 22776 | -0.542 | -0.3385 | Yes |
| 78 | Ripk2 | 22993 | -0.586 | -0.3265 | Yes |
| 79 | Dhx58 | 23022 | -0.593 | -0.3062 | Yes |
| 80 | Mvb12a | 23025 | -0.594 | -0.2849 | Yes |
| 81 | Ifi35 | 23151 | -0.623 | -0.2676 | Yes |
| 82 | Usp18 | 23278 | -0.665 | -0.2489 | Yes |
| 83 | Oas1a | 23349 | -0.691 | -0.2269 | Yes |
| 84 | Psme1 | 23406 | -0.718 | -0.2033 | Yes |
| 85 | Isg20 | 23423 | -0.731 | -0.1775 | Yes |
| 86 | Oasl1 | 23433 | -0.740 | -0.1511 | Yes |
| 87 | Ly6e | 23439 | -0.750 | -0.1242 | Yes |
| 88 | Ifitm3 | 23501 | -0.796 | -0.0980 | Yes |
| 89 | B2m | 23509 | -0.800 | -0.0694 | Yes |
| 90 | Lgals3bp | 23607 | -0.992 | -0.0376 | Yes |
| 91 | Bst2 | 23617 | -1.059 | 0.0003 | Yes |