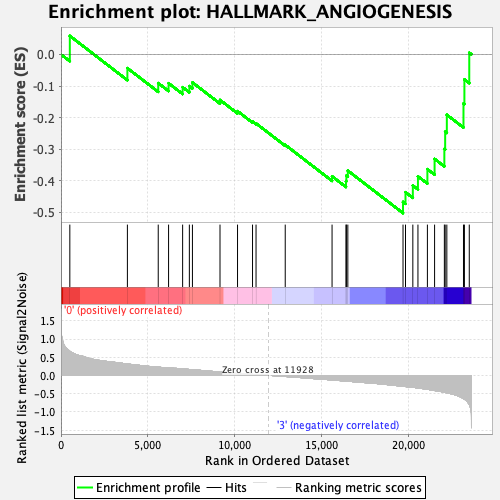
Profile of the Running ES Score & Positions of GeneSet Members on the Rank Ordered List
| Dataset | GMP.GMP.mono_Pheno.cls #Group1_versus_Group4.GMP.mono_Pheno.cls #Group1_versus_Group4_repos |
| Phenotype | GMP.mono_Pheno.cls#Group1_versus_Group4_repos |
| Upregulated in class | 3 |
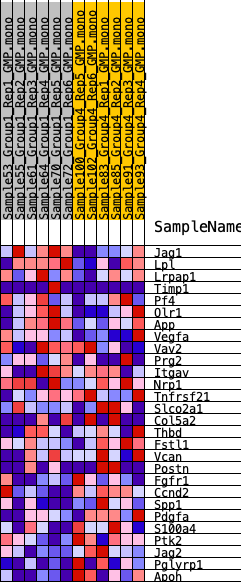
| GeneSet | HALLMARK_ANGIOGENESIS |
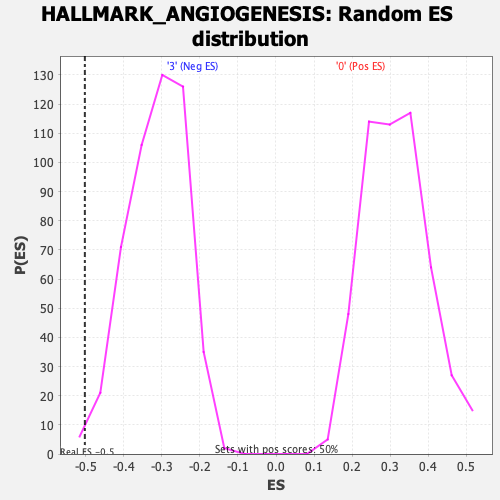
| Enrichment Score (ES) | -0.5024739 |
| Normalized Enrichment Score (NES) | -1.6003033 |
| Nominal p-value | 0.0100603625 |
| FDR q-value | 0.13371605 |
| FWER p-Value | 0.227 |
| SYMBOL | RANK IN GENE LIST | RANK METRIC SCORE | RUNNING ES | CORE ENRICHMENT | |
|---|---|---|---|---|---|
| 1 | Jag1 | 508 | 0.660 | 0.0588 | No |
| 2 | Lpl | 3821 | 0.314 | -0.0434 | No |
| 3 | Lrpap1 | 5596 | 0.228 | -0.0908 | No |
| 4 | Timp1 | 6191 | 0.204 | -0.0912 | No |
| 5 | Pf4 | 7000 | 0.178 | -0.1038 | No |
| 6 | Olr1 | 7387 | 0.163 | -0.1003 | No |
| 7 | App | 7564 | 0.157 | -0.0886 | No |
| 8 | Vegfa | 9151 | 0.096 | -0.1442 | No |
| 9 | Vav2 | 10160 | 0.060 | -0.1795 | No |
| 10 | Prg2 | 11023 | 0.029 | -0.2126 | No |
| 11 | Itgav | 11225 | 0.023 | -0.2183 | No |
| 12 | Nrp1 | 12905 | -0.025 | -0.2864 | No |
| 13 | Tnfrsf21 | 15600 | -0.120 | -0.3859 | No |
| 14 | Slco2a1 | 16401 | -0.153 | -0.4012 | No |
| 15 | Col5a2 | 16425 | -0.154 | -0.3835 | No |
| 16 | Thbd | 16508 | -0.157 | -0.3679 | No |
| 17 | Fstl1 | 19684 | -0.292 | -0.4669 | Yes |
| 18 | Vcan | 19827 | -0.301 | -0.4363 | Yes |
| 19 | Postn | 20249 | -0.323 | -0.4149 | Yes |
| 20 | Fgfr1 | 20543 | -0.339 | -0.3860 | Yes |
| 21 | Ccnd2 | 21087 | -0.376 | -0.3632 | Yes |
| 22 | Spp1 | 21501 | -0.409 | -0.3309 | Yes |
| 23 | Pdgfa | 22063 | -0.458 | -0.2990 | Yes |
| 24 | S100a4 | 22110 | -0.463 | -0.2446 | Yes |
| 25 | Ptk2 | 22206 | -0.473 | -0.1911 | Yes |
| 26 | Jag2 | 23164 | -0.629 | -0.1552 | Yes |
| 27 | Pglyrp1 | 23217 | -0.643 | -0.0791 | Yes |
| 28 | Apoh | 23497 | -0.792 | 0.0054 | Yes |