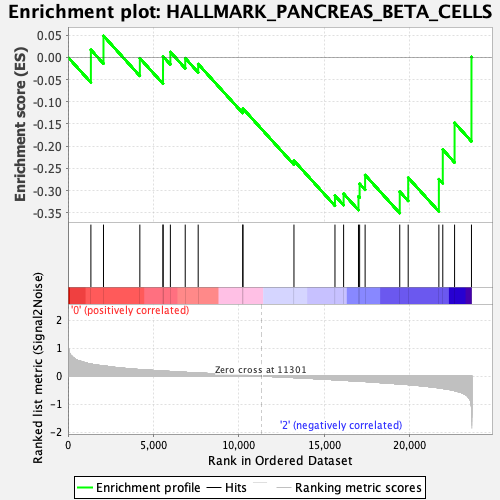
Profile of the Running ES Score & Positions of GeneSet Members on the Rank Ordered List
| Dataset | GMP.GMP.mono_Pheno.cls #Group1_versus_Group3.GMP.mono_Pheno.cls #Group1_versus_Group3_repos |
| Phenotype | GMP.mono_Pheno.cls#Group1_versus_Group3_repos |
| Upregulated in class | 2 |
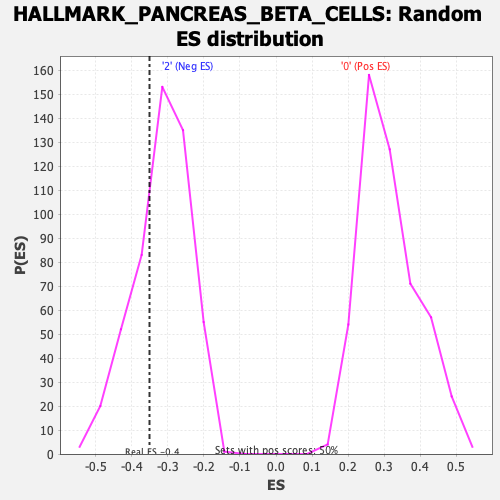
| GeneSet | HALLMARK_PANCREAS_BETA_CELLS |
| Enrichment Score (ES) | -0.35075068 |
| Normalized Enrichment Score (NES) | -1.1079433 |
| Nominal p-value | 0.27888447 |
| FDR q-value | 0.70676 |
| FWER p-Value | 0.962 |
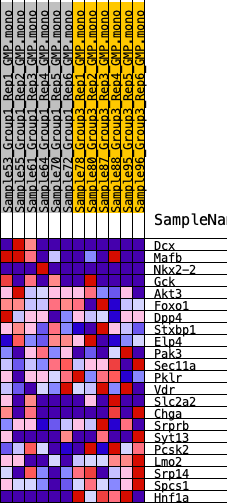
| SYMBOL | RANK IN GENE LIST | RANK METRIC SCORE | RUNNING ES | CORE ENRICHMENT | |
|---|---|---|---|---|---|
| 1 | Dcx | 1339 | 0.425 | 0.0168 | No |
| 2 | Mafb | 2076 | 0.362 | 0.0482 | No |
| 3 | Nkx2-2 | 4203 | 0.230 | -0.0022 | No |
| 4 | Gck | 5559 | 0.178 | -0.0288 | No |
| 5 | Akt3 | 5560 | 0.178 | 0.0020 | No |
| 6 | Foxo1 | 5989 | 0.162 | 0.0119 | No |
| 7 | Dpp4 | 6858 | 0.132 | -0.0020 | No |
| 8 | Stxbp1 | 7616 | 0.109 | -0.0152 | No |
| 9 | Elp4 | 10220 | 0.031 | -0.1201 | No |
| 10 | Pak3 | 10238 | 0.031 | -0.1155 | No |
| 11 | Sec11a | 13219 | -0.053 | -0.2326 | No |
| 12 | Pklr | 15618 | -0.131 | -0.3115 | No |
| 13 | Vdr | 16124 | -0.149 | -0.3070 | No |
| 14 | Slc2a2 | 16994 | -0.178 | -0.3130 | Yes |
| 15 | Chga | 17061 | -0.180 | -0.2848 | Yes |
| 16 | Srprb | 17382 | -0.193 | -0.2650 | Yes |
| 17 | Syt13 | 19408 | -0.279 | -0.3024 | Yes |
| 18 | Pcsk2 | 19902 | -0.303 | -0.2710 | Yes |
| 19 | Lmo2 | 21697 | -0.420 | -0.2743 | Yes |
| 20 | Srp14 | 21926 | -0.441 | -0.2076 | Yes |
| 21 | Spcs1 | 22616 | -0.517 | -0.1475 | Yes |
| 22 | Hnf1a | 23604 | -1.099 | 0.0008 | Yes |