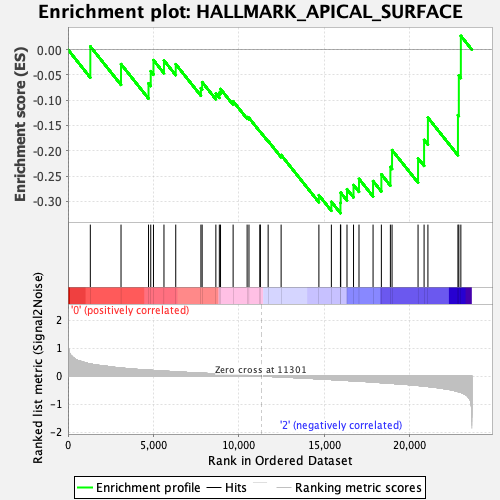
Profile of the Running ES Score & Positions of GeneSet Members on the Rank Ordered List
| Dataset | GMP.GMP.mono_Pheno.cls #Group1_versus_Group3.GMP.mono_Pheno.cls #Group1_versus_Group3_repos |
| Phenotype | GMP.mono_Pheno.cls#Group1_versus_Group3_repos |
| Upregulated in class | 2 |
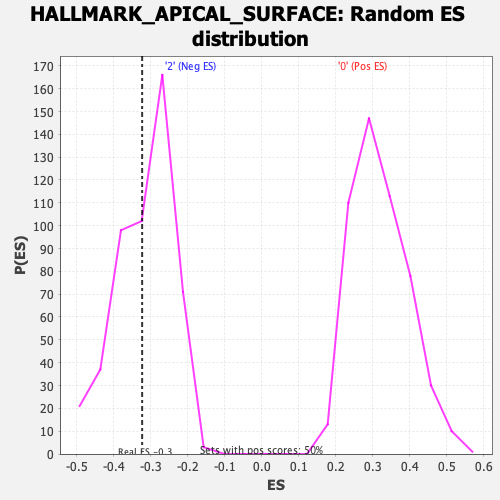
| GeneSet | HALLMARK_APICAL_SURFACE |
| Enrichment Score (ES) | -0.32335493 |
| Normalized Enrichment Score (NES) | -1.0206642 |
| Nominal p-value | 0.40963855 |
| FDR q-value | 0.821197 |
| FWER p-Value | 0.985 |
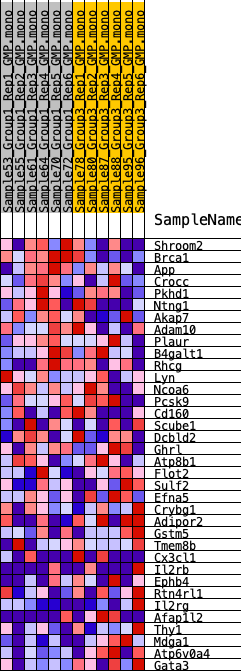
| SYMBOL | RANK IN GENE LIST | RANK METRIC SCORE | RUNNING ES | CORE ENRICHMENT | |
|---|---|---|---|---|---|
| 1 | Shroom2 | 1306 | 0.428 | 0.0063 | No |
| 2 | Brca1 | 3102 | 0.286 | -0.0287 | No |
| 3 | App | 4711 | 0.210 | -0.0666 | No |
| 4 | Crocc | 4841 | 0.205 | -0.0427 | No |
| 5 | Pkhd1 | 5000 | 0.199 | -0.0207 | No |
| 6 | Ntng1 | 5614 | 0.176 | -0.0214 | No |
| 7 | Akap7 | 6303 | 0.151 | -0.0289 | No |
| 8 | Adam10 | 7776 | 0.105 | -0.0761 | No |
| 9 | Plaur | 7848 | 0.103 | -0.0643 | No |
| 10 | B4galt1 | 8650 | 0.079 | -0.0869 | No |
| 11 | Rhcg | 8854 | 0.072 | -0.0851 | No |
| 12 | Lyn | 8923 | 0.070 | -0.0779 | No |
| 13 | Ncoa6 | 9660 | 0.048 | -0.1021 | No |
| 14 | Pcsk9 | 10479 | 0.024 | -0.1334 | No |
| 15 | Cd160 | 10587 | 0.020 | -0.1350 | No |
| 16 | Scube1 | 11221 | 0.003 | -0.1615 | No |
| 17 | Dcbld2 | 11255 | 0.001 | -0.1627 | No |
| 18 | Ghrl | 11709 | -0.008 | -0.1807 | No |
| 19 | Atp8b1 | 12468 | -0.031 | -0.2084 | No |
| 20 | Flot2 | 14678 | -0.099 | -0.2878 | No |
| 21 | Sulf2 | 15408 | -0.124 | -0.3009 | No |
| 22 | Efna5 | 15939 | -0.142 | -0.3029 | Yes |
| 23 | Crybg1 | 15955 | -0.143 | -0.2829 | Yes |
| 24 | Adipor2 | 16322 | -0.155 | -0.2760 | Yes |
| 25 | Gstm5 | 16704 | -0.170 | -0.2678 | Yes |
| 26 | Tmem8b | 17024 | -0.179 | -0.2555 | Yes |
| 27 | Cx3cl1 | 17847 | -0.211 | -0.2600 | Yes |
| 28 | Il2rb | 18333 | -0.235 | -0.2467 | Yes |
| 29 | Ephb4 | 18860 | -0.256 | -0.2321 | Yes |
| 30 | Rtn4rl1 | 18958 | -0.261 | -0.1987 | Yes |
| 31 | Il2rg | 20479 | -0.334 | -0.2150 | Yes |
| 32 | Afap1l2 | 20832 | -0.357 | -0.1786 | Yes |
| 33 | Thy1 | 21056 | -0.372 | -0.1345 | Yes |
| 34 | Mdga1 | 22813 | -0.552 | -0.1295 | Yes |
| 35 | Atp6v0a4 | 22865 | -0.558 | -0.0514 | Yes |
| 36 | Gata3 | 22983 | -0.580 | 0.0272 | Yes |