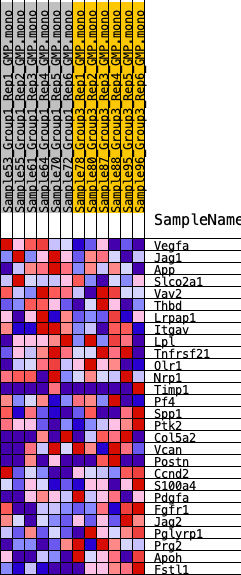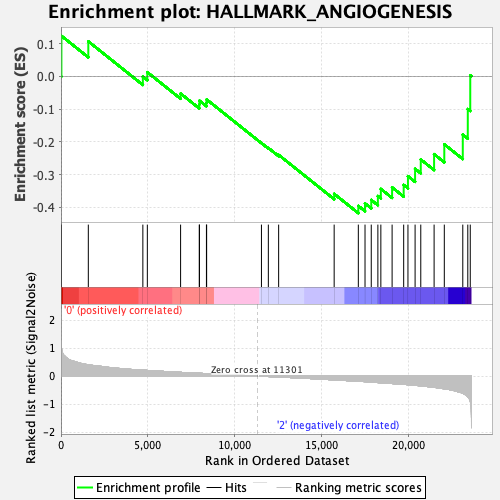
Profile of the Running ES Score & Positions of GeneSet Members on the Rank Ordered List
| Dataset | GMP.GMP.mono_Pheno.cls #Group1_versus_Group3.GMP.mono_Pheno.cls #Group1_versus_Group3_repos |
| Phenotype | GMP.mono_Pheno.cls#Group1_versus_Group3_repos |
| Upregulated in class | 2 |
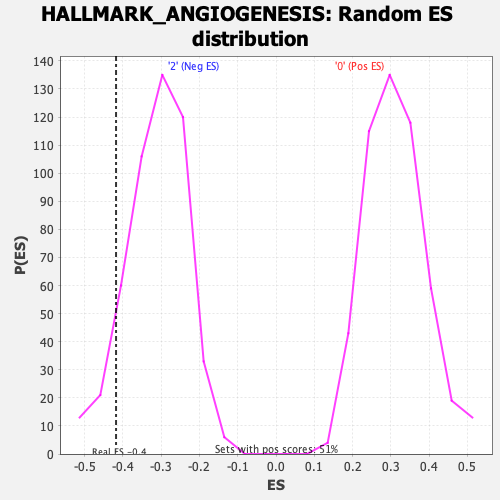
| GeneSet | HALLMARK_ANGIOGENESIS |
| Enrichment Score (ES) | -0.4179118 |
| Normalized Enrichment Score (NES) | -1.3329312 |
| Nominal p-value | 0.08906882 |
| FDR q-value | 0.616153 |
| FWER p-Value | 0.73 |
| SYMBOL | RANK IN GENE LIST | RANK METRIC SCORE | RUNNING ES | CORE ENRICHMENT | |
|---|---|---|---|---|---|
| 1 | Vegfa | 24 | 1.024 | 0.1234 | No |
| 2 | Jag1 | 1572 | 0.400 | 0.1065 | No |
| 3 | App | 4711 | 0.210 | -0.0010 | No |
| 4 | Slco2a1 | 4969 | 0.200 | 0.0125 | No |
| 5 | Vav2 | 6883 | 0.131 | -0.0527 | No |
| 6 | Thbd | 7960 | 0.099 | -0.0862 | No |
| 7 | Lrpap1 | 7967 | 0.099 | -0.0745 | No |
| 8 | Itgav | 8370 | 0.088 | -0.0809 | No |
| 9 | Lpl | 8382 | 0.087 | -0.0707 | No |
| 10 | Tnfrsf21 | 11536 | -0.003 | -0.2040 | No |
| 11 | Olr1 | 11933 | -0.016 | -0.2189 | No |
| 12 | Nrp1 | 12526 | -0.032 | -0.2401 | No |
| 13 | Timp1 | 15721 | -0.135 | -0.3590 | No |
| 14 | Pf4 | 17112 | -0.182 | -0.3958 | Yes |
| 15 | Spp1 | 17497 | -0.197 | -0.3882 | Yes |
| 16 | Ptk2 | 17856 | -0.212 | -0.3776 | Yes |
| 17 | Col5a2 | 18237 | -0.230 | -0.3657 | Yes |
| 18 | Vcan | 18408 | -0.238 | -0.3440 | Yes |
| 19 | Postn | 19056 | -0.265 | -0.3392 | Yes |
| 20 | Ccnd2 | 19722 | -0.293 | -0.3318 | Yes |
| 21 | S100a4 | 19968 | -0.306 | -0.3050 | Yes |
| 22 | Pdgfa | 20379 | -0.328 | -0.2825 | Yes |
| 23 | Fgfr1 | 20706 | -0.349 | -0.2539 | Yes |
| 24 | Jag2 | 21473 | -0.399 | -0.2379 | Yes |
| 25 | Pglyrp1 | 22060 | -0.453 | -0.2077 | Yes |
| 26 | Prg2 | 23124 | -0.615 | -0.1780 | Yes |
| 27 | Apoh | 23412 | -0.741 | -0.1001 | Yes |
| 28 | Fstl1 | 23554 | -0.897 | 0.0030 | Yes |