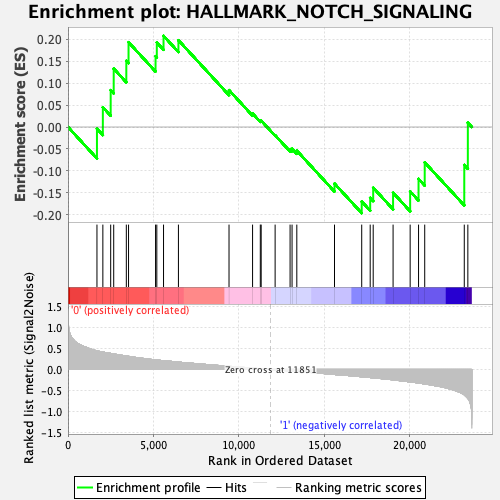
Profile of the Running ES Score & Positions of GeneSet Members on the Rank Ordered List
| Dataset | GMP.GMP.mono_Pheno.cls #Group1_versus_Group2.GMP.mono_Pheno.cls #Group1_versus_Group2_repos |
| Phenotype | GMP.mono_Pheno.cls#Group1_versus_Group2_repos |
| Upregulated in class | 0 |
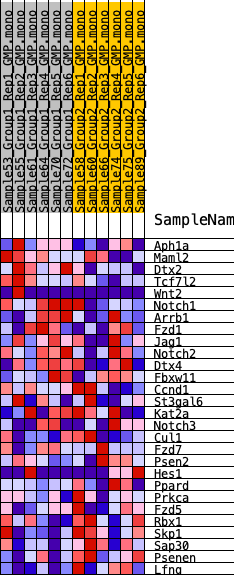
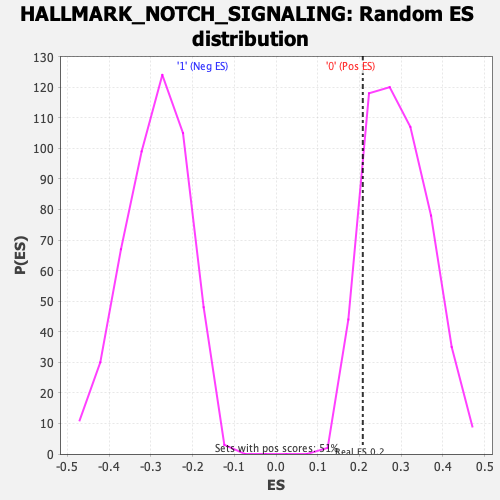
| GeneSet | HALLMARK_NOTCH_SIGNALING |
| Enrichment Score (ES) | 0.20801592 |
| Normalized Enrichment Score (NES) | 0.71801966 |
| Nominal p-value | 0.8791423 |
| FDR q-value | 0.82918864 |
| FWER p-Value | 1.0 |
| SYMBOL | RANK IN GENE LIST | RANK METRIC SCORE | RUNNING ES | CORE ENRICHMENT | |
|---|---|---|---|---|---|
| 1 | Aph1a | 1694 | 0.442 | -0.0039 | Yes |
| 2 | Maml2 | 2039 | 0.414 | 0.0451 | Yes |
| 3 | Dtx2 | 2497 | 0.380 | 0.0841 | Yes |
| 4 | Tcf7l2 | 2674 | 0.368 | 0.1332 | Yes |
| 5 | Wnt2 | 3412 | 0.320 | 0.1511 | Yes |
| 6 | Notch1 | 3542 | 0.311 | 0.1935 | Yes |
| 7 | Arrb1 | 5122 | 0.228 | 0.1616 | Yes |
| 8 | Fzd1 | 5196 | 0.224 | 0.1929 | Yes |
| 9 | Jag1 | 5589 | 0.207 | 0.2080 | Yes |
| 10 | Notch2 | 6460 | 0.175 | 0.1980 | No |
| 11 | Dtx4 | 9420 | 0.075 | 0.0841 | No |
| 12 | Fbxw11 | 10798 | 0.032 | 0.0307 | No |
| 13 | Ccnd1 | 11250 | 0.017 | 0.0143 | No |
| 14 | St3gal6 | 11301 | 0.015 | 0.0145 | No |
| 15 | Kat2a | 12117 | -0.008 | -0.0189 | No |
| 16 | Notch3 | 12992 | -0.035 | -0.0506 | No |
| 17 | Cul1 | 13108 | -0.039 | -0.0495 | No |
| 18 | Fzd7 | 13386 | -0.047 | -0.0539 | No |
| 19 | Psen2 | 15591 | -0.118 | -0.1292 | No |
| 20 | Hes1 | 17183 | -0.172 | -0.1701 | No |
| 21 | Ppard | 17679 | -0.191 | -0.1616 | No |
| 22 | Prkca | 17855 | -0.199 | -0.1385 | No |
| 23 | Fzd5 | 19018 | -0.246 | -0.1500 | No |
| 24 | Rbx1 | 20017 | -0.295 | -0.1470 | No |
| 25 | Skp1 | 20508 | -0.321 | -0.1184 | No |
| 26 | Sap30 | 20869 | -0.344 | -0.0808 | No |
| 27 | Psenen | 23183 | -0.600 | -0.0866 | No |
| 28 | Lfng | 23392 | -0.685 | 0.0098 | No |