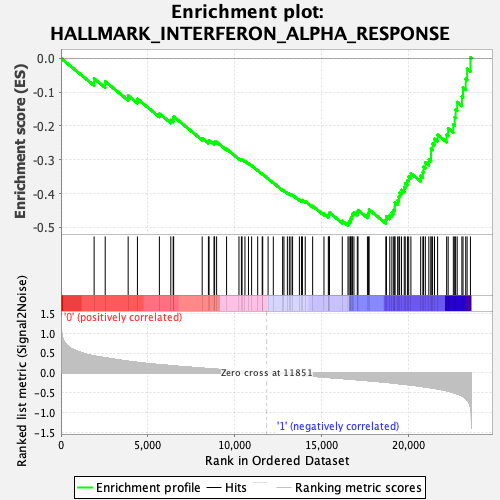
Profile of the Running ES Score & Positions of GeneSet Members on the Rank Ordered List
| Dataset | GMP.GMP.mono_Pheno.cls #Group1_versus_Group2.GMP.mono_Pheno.cls #Group1_versus_Group2_repos |
| Phenotype | GMP.mono_Pheno.cls#Group1_versus_Group2_repos |
| Upregulated in class | 1 |
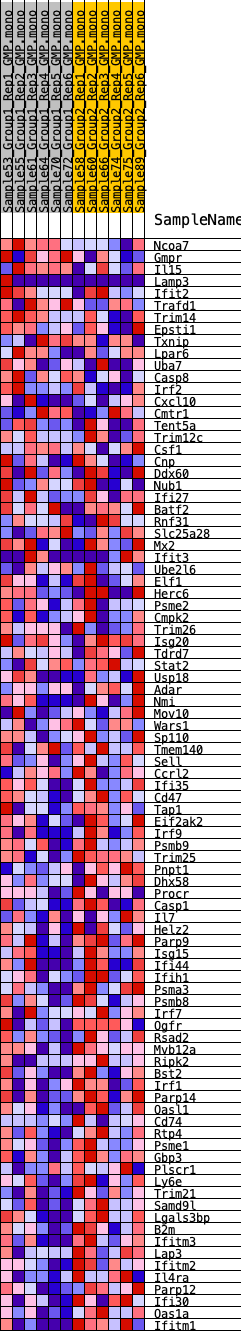
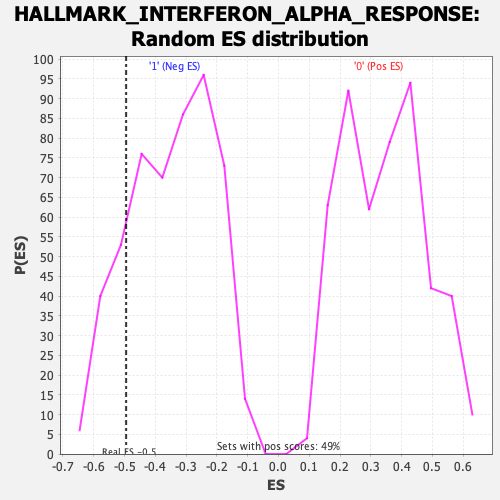
| GeneSet | HALLMARK_INTERFERON_ALPHA_RESPONSE |
| Enrichment Score (ES) | -0.49476206 |
| Normalized Enrichment Score (NES) | -1.4257343 |
| Nominal p-value | 0.16536964 |
| FDR q-value | 0.14353512 |
| FWER p-Value | 0.496 |
| SYMBOL | RANK IN GENE LIST | RANK METRIC SCORE | RUNNING ES | CORE ENRICHMENT | |
|---|---|---|---|---|---|
| 1 | Ncoa7 | 1906 | 0.424 | -0.0601 | No |
| 2 | Gmpr | 2544 | 0.376 | -0.0686 | No |
| 3 | Il15 | 3865 | 0.290 | -0.1104 | No |
| 4 | Lamp3 | 4398 | 0.262 | -0.1201 | No |
| 5 | Ifit2 | 5662 | 0.204 | -0.1637 | No |
| 6 | Trafd1 | 6319 | 0.180 | -0.1827 | No |
| 7 | Trim14 | 6457 | 0.175 | -0.1799 | No |
| 8 | Epsti1 | 6484 | 0.174 | -0.1725 | No |
| 9 | Txnip | 8125 | 0.117 | -0.2364 | No |
| 10 | Lpar6 | 8484 | 0.104 | -0.2465 | No |
| 11 | Uba7 | 8522 | 0.103 | -0.2430 | No |
| 12 | Casp8 | 8807 | 0.095 | -0.2504 | No |
| 13 | Irf2 | 8841 | 0.094 | -0.2471 | No |
| 14 | Cxcl10 | 8956 | 0.090 | -0.2475 | No |
| 15 | Cmtr1 | 9530 | 0.072 | -0.2683 | No |
| 16 | Tent5a | 10242 | 0.050 | -0.2961 | No |
| 17 | Trim12c | 10383 | 0.045 | -0.2998 | No |
| 18 | Csf1 | 10420 | 0.044 | -0.2992 | No |
| 19 | Cnp | 10586 | 0.038 | -0.3043 | No |
| 20 | Ddx60 | 10790 | 0.032 | -0.3113 | No |
| 21 | Nub1 | 10970 | 0.027 | -0.3176 | No |
| 22 | Ifi27 | 11320 | 0.015 | -0.3317 | No |
| 23 | Batf2 | 11580 | 0.008 | -0.3423 | No |
| 24 | Rnf31 | 11610 | 0.007 | -0.3432 | No |
| 25 | Slc25a28 | 11919 | -0.001 | -0.3562 | No |
| 26 | Mx2 | 12219 | -0.011 | -0.3684 | No |
| 27 | Ifit3 | 12755 | -0.027 | -0.3898 | No |
| 28 | Ube2l6 | 12830 | -0.029 | -0.3915 | No |
| 29 | Elf1 | 13029 | -0.036 | -0.3981 | No |
| 30 | Herc6 | 13141 | -0.040 | -0.4009 | No |
| 31 | Psme2 | 13234 | -0.042 | -0.4027 | No |
| 32 | Cmpk2 | 13328 | -0.045 | -0.4044 | No |
| 33 | Trim26 | 13720 | -0.058 | -0.4182 | No |
| 34 | Isg20 | 13839 | -0.062 | -0.4202 | No |
| 35 | Tdrd7 | 13895 | -0.064 | -0.4194 | No |
| 36 | Stat2 | 14056 | -0.068 | -0.4228 | No |
| 37 | Usp18 | 14483 | -0.081 | -0.4369 | No |
| 38 | Adar | 15134 | -0.102 | -0.4595 | No |
| 39 | Nmi | 15386 | -0.111 | -0.4647 | No |
| 40 | Mov10 | 15421 | -0.112 | -0.4606 | No |
| 41 | Wars1 | 15449 | -0.113 | -0.4562 | No |
| 42 | Sp110 | 16188 | -0.137 | -0.4808 | No |
| 43 | Tmem140 | 16517 | -0.148 | -0.4875 | Yes |
| 44 | Sell | 16583 | -0.151 | -0.4828 | Yes |
| 45 | Ccrl2 | 16661 | -0.153 | -0.4785 | Yes |
| 46 | Ifi35 | 16688 | -0.154 | -0.4720 | Yes |
| 47 | Cd47 | 16747 | -0.157 | -0.4668 | Yes |
| 48 | Tap1 | 16768 | -0.158 | -0.4598 | Yes |
| 49 | Eif2ak2 | 16859 | -0.161 | -0.4558 | Yes |
| 50 | Irf9 | 17053 | -0.168 | -0.4557 | Yes |
| 51 | Psmb9 | 17093 | -0.169 | -0.4490 | Yes |
| 52 | Trim25 | 17636 | -0.190 | -0.4627 | Yes |
| 53 | Pnpt1 | 17703 | -0.192 | -0.4560 | Yes |
| 54 | Dhx58 | 17732 | -0.193 | -0.4477 | Yes |
| 55 | Procr | 18695 | -0.231 | -0.4772 | Yes |
| 56 | Casp1 | 18731 | -0.232 | -0.4673 | Yes |
| 57 | Il7 | 18923 | -0.241 | -0.4635 | Yes |
| 58 | Helz2 | 19043 | -0.247 | -0.4564 | Yes |
| 59 | Parp9 | 19147 | -0.252 | -0.4484 | Yes |
| 60 | Isg15 | 19213 | -0.255 | -0.4386 | Yes |
| 61 | Ifi44 | 19215 | -0.255 | -0.4261 | Yes |
| 62 | Ifih1 | 19375 | -0.264 | -0.4198 | Yes |
| 63 | Psma3 | 19447 | -0.268 | -0.4097 | Yes |
| 64 | Psmb8 | 19489 | -0.270 | -0.3981 | Yes |
| 65 | Irf7 | 19598 | -0.276 | -0.3891 | Yes |
| 66 | Ogfr | 19755 | -0.281 | -0.3819 | Yes |
| 67 | Rsad2 | 19811 | -0.284 | -0.3702 | Yes |
| 68 | Mvb12a | 19938 | -0.291 | -0.3613 | Yes |
| 69 | Ripk2 | 20009 | -0.294 | -0.3497 | Yes |
| 70 | Bst2 | 20138 | -0.302 | -0.3403 | Yes |
| 71 | Irf1 | 20700 | -0.333 | -0.3477 | Yes |
| 72 | Parp14 | 20827 | -0.340 | -0.3363 | Yes |
| 73 | Oasl1 | 20866 | -0.343 | -0.3210 | Yes |
| 74 | Cd74 | 20968 | -0.350 | -0.3081 | Yes |
| 75 | Rtp4 | 21170 | -0.363 | -0.2988 | Yes |
| 76 | Psme1 | 21295 | -0.372 | -0.2857 | Yes |
| 77 | Gbp3 | 21297 | -0.372 | -0.2674 | Yes |
| 78 | Plscr1 | 21385 | -0.379 | -0.2525 | Yes |
| 79 | Ly6e | 21496 | -0.386 | -0.2381 | Yes |
| 80 | Trim21 | 21675 | -0.398 | -0.2261 | Yes |
| 81 | Samd9l | 22196 | -0.445 | -0.2263 | Yes |
| 82 | Lgals3bp | 22282 | -0.455 | -0.2075 | Yes |
| 83 | B2m | 22580 | -0.492 | -0.1959 | Yes |
| 84 | Ifitm3 | 22658 | -0.502 | -0.1744 | Yes |
| 85 | Lap3 | 22711 | -0.510 | -0.1515 | Yes |
| 86 | Ifitm2 | 22802 | -0.525 | -0.1295 | Yes |
| 87 | Il4ra | 23072 | -0.574 | -0.1126 | Yes |
| 88 | Parp12 | 23137 | -0.591 | -0.0863 | Yes |
| 89 | Ifi30 | 23292 | -0.642 | -0.0612 | Yes |
| 90 | Oas1a | 23372 | -0.679 | -0.0311 | Yes |
| 91 | Ifitm1 | 23565 | -0.849 | 0.0025 | Yes |