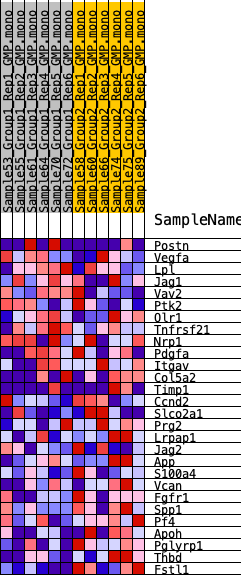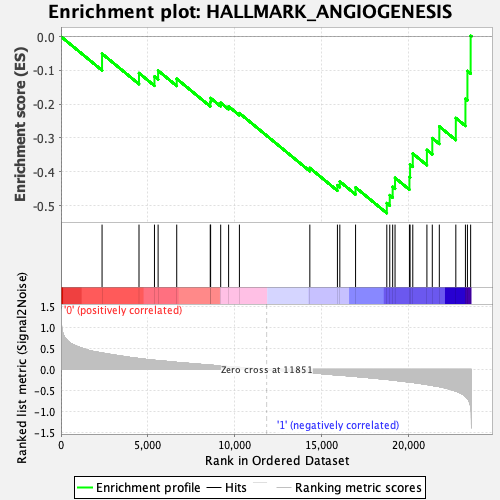
Profile of the Running ES Score & Positions of GeneSet Members on the Rank Ordered List
| Dataset | GMP.GMP.mono_Pheno.cls #Group1_versus_Group2.GMP.mono_Pheno.cls #Group1_versus_Group2_repos |
| Phenotype | GMP.mono_Pheno.cls#Group1_versus_Group2_repos |
| Upregulated in class | 1 |
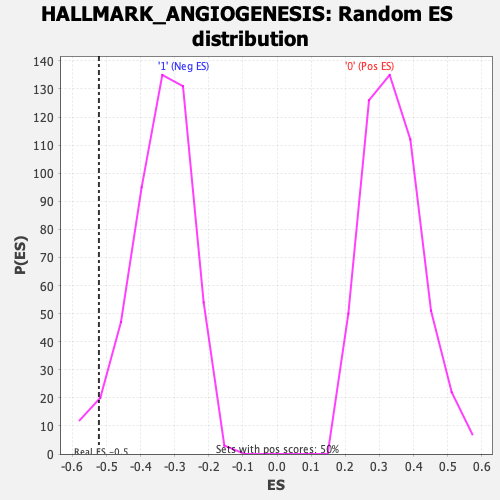
| GeneSet | HALLMARK_ANGIOGENESIS |
| Enrichment Score (ES) | -0.5223917 |
| Normalized Enrichment Score (NES) | -1.5230374 |
| Nominal p-value | 0.03420523 |
| FDR q-value | 0.08996074 |
| FWER p-Value | 0.358 |
| SYMBOL | RANK IN GENE LIST | RANK METRIC SCORE | RUNNING ES | CORE ENRICHMENT | |
|---|---|---|---|---|---|
| 1 | Postn | 2363 | 0.389 | -0.0507 | No |
| 2 | Vegfa | 4489 | 0.258 | -0.1080 | No |
| 3 | Lpl | 5379 | 0.216 | -0.1182 | No |
| 4 | Jag1 | 5589 | 0.207 | -0.1008 | No |
| 5 | Vav2 | 6660 | 0.166 | -0.1250 | No |
| 6 | Ptk2 | 8590 | 0.101 | -0.1939 | No |
| 7 | Olr1 | 8611 | 0.100 | -0.1819 | No |
| 8 | Tnfrsf21 | 9190 | 0.083 | -0.1959 | No |
| 9 | Nrp1 | 9646 | 0.068 | -0.2065 | No |
| 10 | Pdgfa | 10268 | 0.049 | -0.2267 | No |
| 11 | Itgav | 14321 | -0.076 | -0.3888 | No |
| 12 | Col5a2 | 15909 | -0.128 | -0.4398 | No |
| 13 | Timp1 | 16047 | -0.132 | -0.4288 | No |
| 14 | Ccnd2 | 16953 | -0.164 | -0.4462 | No |
| 15 | Slco2a1 | 18751 | -0.234 | -0.4927 | Yes |
| 16 | Prg2 | 18921 | -0.241 | -0.4692 | Yes |
| 17 | Lrpap1 | 19088 | -0.249 | -0.4446 | Yes |
| 18 | Jag2 | 19225 | -0.255 | -0.4179 | Yes |
| 19 | App | 20053 | -0.297 | -0.4152 | Yes |
| 20 | S100a4 | 20090 | -0.299 | -0.3787 | Yes |
| 21 | Vcan | 20246 | -0.308 | -0.3461 | Yes |
| 22 | Fgfr1 | 21059 | -0.355 | -0.3354 | Yes |
| 23 | Spp1 | 21369 | -0.378 | -0.3005 | Yes |
| 24 | Pf4 | 21773 | -0.406 | -0.2659 | Yes |
| 25 | Apoh | 22723 | -0.512 | -0.2410 | Yes |
| 26 | Pglyrp1 | 23276 | -0.632 | -0.1840 | Yes |
| 27 | Thbd | 23391 | -0.684 | -0.1018 | Yes |
| 28 | Fstl1 | 23576 | -0.878 | 0.0020 | Yes |