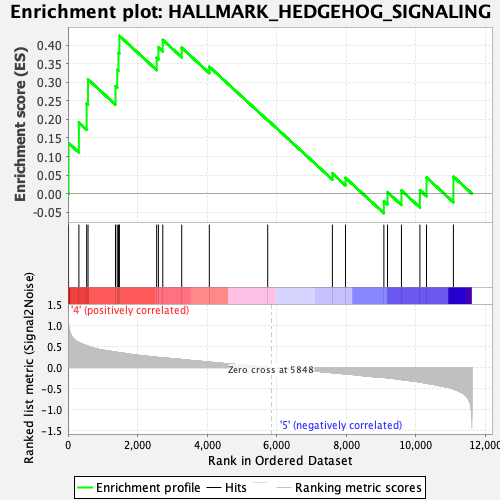
Profile of the Running ES Score & Positions of GeneSet Members on the Rank Ordered List
| Dataset | Eosinophil.Eosinophil_Pheno.cls #Group6_versus_Group8.Eosinophil_Pheno.cls #Group6_versus_Group8_repos |
| Phenotype | Eosinophil_Pheno.cls#Group6_versus_Group8_repos |
| Upregulated in class | 4 |
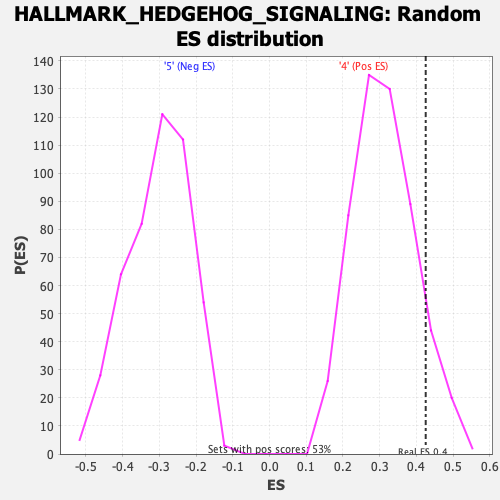
| GeneSet | HALLMARK_HEDGEHOG_SIGNALING |
| Enrichment Score (ES) | 0.4252578 |
| Normalized Enrichment Score (NES) | 1.3620067 |
| Nominal p-value | 0.084745765 |
| FDR q-value | 1.0 |
| FWER p-Value | 0.556 |
| SYMBOL | RANK IN GENE LIST | RANK METRIC SCORE | RUNNING ES | CORE ENRICHMENT | |
|---|---|---|---|---|---|
| 1 | Vegfa | 16 | 1.020 | 0.1364 | Yes |
| 2 | Tle3 | 313 | 0.596 | 0.1914 | Yes |
| 3 | Rasa1 | 537 | 0.520 | 0.2425 | Yes |
| 4 | Cdk5r1 | 576 | 0.508 | 0.3079 | Yes |
| 5 | Myh9 | 1366 | 0.368 | 0.2895 | Yes |
| 6 | Ets2 | 1415 | 0.361 | 0.3342 | Yes |
| 7 | Vldlr | 1451 | 0.358 | 0.3795 | Yes |
| 8 | Nf1 | 1478 | 0.355 | 0.4253 | Yes |
| 9 | Ldb1 | 2549 | 0.245 | 0.3660 | No |
| 10 | Amot | 2599 | 0.239 | 0.3942 | No |
| 11 | Nrp1 | 2725 | 0.230 | 0.4144 | No |
| 12 | Ptch1 | 3269 | 0.190 | 0.3932 | No |
| 13 | Dpysl2 | 4063 | 0.129 | 0.3422 | No |
| 14 | Ophn1 | 5741 | 0.006 | 0.1983 | No |
| 15 | Cdk6 | 7601 | -0.123 | 0.0545 | No |
| 16 | Pml | 7978 | -0.151 | 0.0424 | No |
| 17 | L1cam | 9081 | -0.239 | -0.0203 | No |
| 18 | Adgrg1 | 9185 | -0.245 | 0.0039 | No |
| 19 | Tle1 | 9586 | -0.288 | 0.0083 | No |
| 20 | Unc5c | 10117 | -0.346 | 0.0093 | No |
| 21 | Celsr1 | 10307 | -0.373 | 0.0434 | No |
| 22 | Nrp2 | 11080 | -0.509 | 0.0457 | No |