Profile of the Running ES Score & Positions of GeneSet Members on the Rank Ordered List
| Dataset | Eosinophil.Eosinophil_Pheno.cls #Group2_versus_Group3.Eosinophil_Pheno.cls #Group2_versus_Group3_repos |
| Phenotype | Eosinophil_Pheno.cls#Group2_versus_Group3_repos |
| Upregulated in class | 1 |
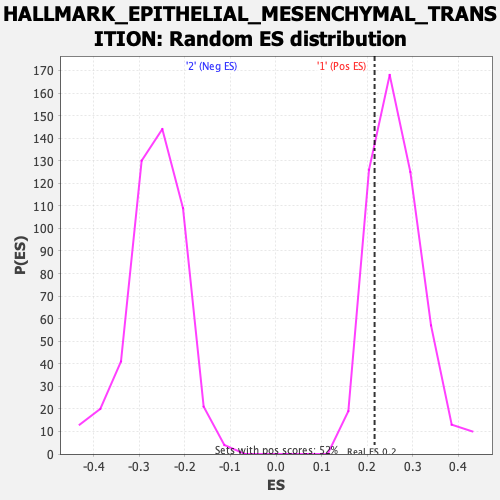
| GeneSet | HALLMARK_EPITHELIAL_MESENCHYMAL_TRANSITION |
| Enrichment Score (ES) | 0.21621092 |
| Normalized Enrichment Score (NES) | 0.82251257 |
| Nominal p-value | 0.78571427 |
| FDR q-value | 1.0 |
| FWER p-Value | 1.0 |
| SYMBOL | RANK IN GENE LIST | RANK METRIC SCORE | RUNNING ES | CORE ENRICHMENT | |
|---|---|---|---|---|---|
| 1 | Tgfbi | 165 | 0.653 | 0.0253 | Yes |
| 2 | Copa | 247 | 0.600 | 0.0547 | Yes |
| 3 | Jun | 361 | 0.548 | 0.0781 | Yes |
| 4 | Qsox1 | 417 | 0.528 | 0.1053 | Yes |
| 5 | Vcam1 | 520 | 0.493 | 0.1264 | Yes |
| 6 | Dst | 888 | 0.401 | 0.1190 | Yes |
| 7 | Itga2 | 962 | 0.390 | 0.1363 | Yes |
| 8 | Sgcb | 969 | 0.389 | 0.1594 | Yes |
| 9 | Wipf1 | 1052 | 0.379 | 0.1753 | Yes |
| 10 | Calu | 1133 | 0.364 | 0.1904 | Yes |
| 11 | Colgalt1 | 1525 | 0.313 | 0.1755 | Yes |
| 12 | Thbs1 | 1587 | 0.304 | 0.1886 | Yes |
| 13 | Lamc1 | 1771 | 0.283 | 0.1899 | Yes |
| 14 | Itga5 | 2243 | 0.235 | 0.1634 | Yes |
| 15 | Glipr1 | 2255 | 0.234 | 0.1767 | Yes |
| 16 | Vegfa | 2258 | 0.234 | 0.1906 | Yes |
| 17 | Tgfbr3 | 2355 | 0.223 | 0.1958 | Yes |
| 18 | Emp3 | 2402 | 0.218 | 0.2051 | Yes |
| 19 | Sat1 | 2426 | 0.216 | 0.2162 | Yes |
| 20 | Cd44 | 2654 | 0.195 | 0.2084 | No |
| 21 | Flna | 2736 | 0.190 | 0.2128 | No |
| 22 | Gja1 | 2997 | 0.165 | 0.2003 | No |
| 23 | Capg | 3053 | 0.160 | 0.2053 | No |
| 24 | Tnfaip3 | 3360 | 0.136 | 0.1870 | No |
| 25 | Vegfc | 3506 | 0.126 | 0.1821 | No |
| 26 | Pvr | 3704 | 0.111 | 0.1717 | No |
| 27 | Mylk | 3828 | 0.101 | 0.1672 | No |
| 28 | Notch2 | 3951 | 0.093 | 0.1623 | No |
| 29 | Vim | 4099 | 0.081 | 0.1544 | No |
| 30 | Mcm7 | 4348 | 0.060 | 0.1366 | No |
| 31 | Serpine2 | 4700 | 0.035 | 0.1084 | No |
| 32 | Ntm | 5060 | 0.007 | 0.0777 | No |
| 33 | Gadd45a | 5199 | -0.002 | 0.0659 | No |
| 34 | Il15 | 5438 | -0.021 | 0.0466 | No |
| 35 | Ecm1 | 5558 | -0.030 | 0.0380 | No |
| 36 | Tpm1 | 5765 | -0.046 | 0.0230 | No |
| 37 | Itgav | 6170 | -0.075 | -0.0075 | No |
| 38 | Pmepa1 | 6379 | -0.092 | -0.0199 | No |
| 39 | Pdgfrb | 6630 | -0.112 | -0.0347 | No |
| 40 | Ppib | 6943 | -0.138 | -0.0534 | No |
| 41 | Tpm4 | 7148 | -0.155 | -0.0617 | No |
| 42 | P3h1 | 7250 | -0.163 | -0.0606 | No |
| 43 | Tgfb1 | 7650 | -0.195 | -0.0833 | No |
| 44 | Rhob | 7792 | -0.207 | -0.0829 | No |
| 45 | Lgals1 | 7825 | -0.211 | -0.0729 | No |
| 46 | Basp1 | 8203 | -0.241 | -0.0909 | No |
| 47 | Fuca1 | 8238 | -0.244 | -0.0791 | No |
| 48 | Plod1 | 8717 | -0.289 | -0.1029 | No |
| 49 | Ecm2 | 9139 | -0.331 | -0.1193 | No |
| 50 | Igfbp4 | 9334 | -0.350 | -0.1149 | No |
| 51 | Bmp1 | 9403 | -0.356 | -0.0993 | No |
| 52 | Fas | 9567 | -0.374 | -0.0907 | No |
| 53 | Itgb1 | 9810 | -0.400 | -0.0874 | No |
| 54 | Gpc1 | 10003 | -0.428 | -0.0781 | No |
| 55 | Plod2 | 10144 | -0.450 | -0.0629 | No |
| 56 | Plod3 | 10291 | -0.474 | -0.0468 | No |
| 57 | Plaur | 10315 | -0.478 | -0.0198 | No |
| 58 | Sntb1 | 10541 | -0.509 | -0.0085 | No |
| 59 | Gadd45b | 10548 | -0.510 | 0.0219 | No |
| 60 | Itgb5 | 10838 | -0.568 | 0.0313 | No |
| 61 | Itgb3 | 10891 | -0.583 | 0.0622 | No |