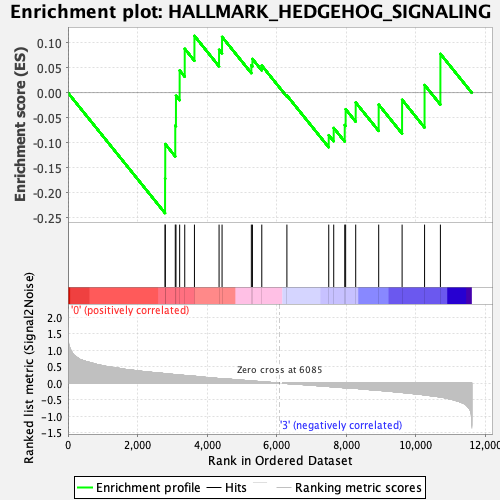
Profile of the Running ES Score & Positions of GeneSet Members on the Rank Ordered List
| Dataset | Eosinophil.Eosinophil_Pheno.cls #Group1_versus_Group4.Eosinophil_Pheno.cls #Group1_versus_Group4_repos |
| Phenotype | Eosinophil_Pheno.cls#Group1_versus_Group4_repos |
| Upregulated in class | 3 |
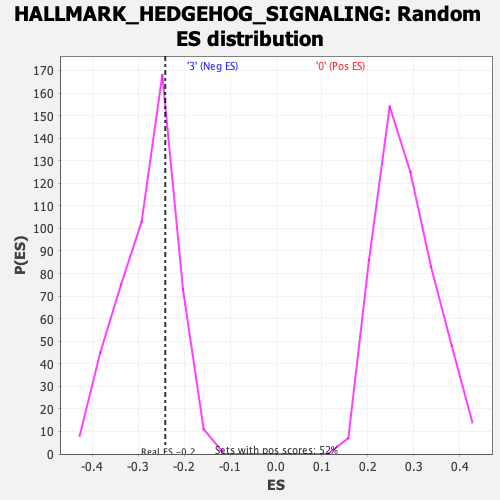
| GeneSet | HALLMARK_HEDGEHOG_SIGNALING |
| Enrichment Score (ES) | -0.24085261 |
| Normalized Enrichment Score (NES) | -0.8664616 |
| Nominal p-value | 0.71428573 |
| FDR q-value | 0.8960926 |
| FWER p-Value | 1.0 |
| SYMBOL | RANK IN GENE LIST | RANK METRIC SCORE | RUNNING ES | CORE ENRICHMENT | |
|---|---|---|---|---|---|
| 1 | L1cam | 2791 | 0.287 | -0.1715 | Yes |
| 2 | Cdk5r1 | 2796 | 0.287 | -0.1026 | Yes |
| 3 | Tle3 | 3084 | 0.256 | -0.0655 | Yes |
| 4 | Ophn1 | 3104 | 0.254 | -0.0058 | Yes |
| 5 | Adgrg1 | 3210 | 0.247 | 0.0447 | Yes |
| 6 | Myh9 | 3356 | 0.231 | 0.0881 | Yes |
| 7 | Dpysl2 | 3635 | 0.206 | 0.1139 | Yes |
| 8 | Nrp2 | 4343 | 0.138 | 0.0862 | Yes |
| 9 | Nrp1 | 4429 | 0.137 | 0.1119 | Yes |
| 10 | Nf1 | 5271 | 0.066 | 0.0552 | Yes |
| 11 | Amot | 5302 | 0.063 | 0.0678 | Yes |
| 12 | Ldb1 | 5571 | 0.041 | 0.0545 | Yes |
| 13 | Pml | 6293 | -0.010 | -0.0054 | Yes |
| 14 | Vegfa | 7496 | -0.100 | -0.0849 | Yes |
| 15 | Rasa1 | 7639 | -0.111 | -0.0704 | Yes |
| 16 | Unc5c | 7956 | -0.137 | -0.0644 | Yes |
| 17 | Cdk6 | 7982 | -0.139 | -0.0329 | Yes |
| 18 | Vldlr | 8271 | -0.159 | -0.0194 | Yes |
| 19 | Tle1 | 8932 | -0.218 | -0.0237 | Yes |
| 20 | Ptch1 | 9605 | -0.280 | -0.0139 | Yes |
| 21 | Celsr1 | 10251 | -0.353 | 0.0156 | Yes |
| 22 | Ets2 | 10706 | -0.420 | 0.0779 | Yes |