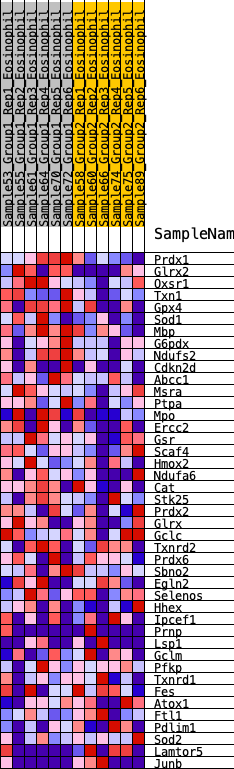
Profile of the Running ES Score & Positions of GeneSet Members on the Rank Ordered List
| Dataset | Eosinophil.Eosinophil_Pheno.cls #Group1_versus_Group2.Eosinophil_Pheno.cls #Group1_versus_Group2_repos |
| Phenotype | Eosinophil_Pheno.cls#Group1_versus_Group2_repos |
| Upregulated in class | 0 |
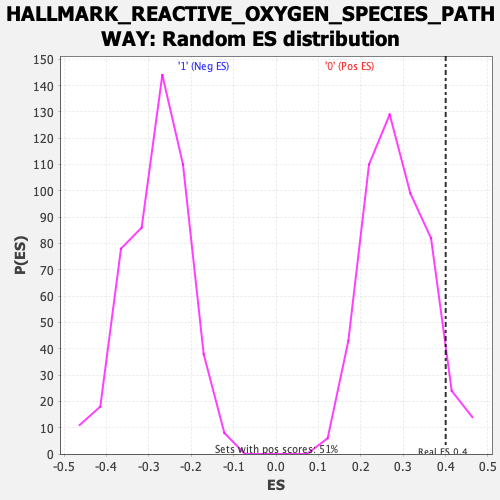
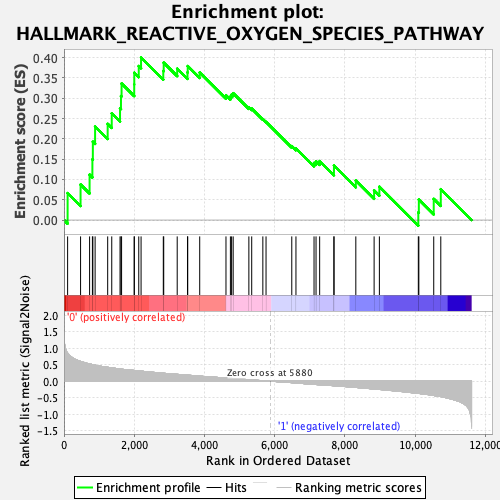
| GeneSet | HALLMARK_REACTIVE_OXYGEN_SPECIES_PATHWAY |
| Enrichment Score (ES) | 0.40033495 |
| Normalized Enrichment Score (NES) | 1.4060667 |
| Nominal p-value | 0.061143983 |
| FDR q-value | 0.17976882 |
| FWER p-Value | 0.494 |
| SYMBOL | RANK IN GENE LIST | RANK METRIC SCORE | RUNNING ES | CORE ENRICHMENT | |
|---|---|---|---|---|---|
| 1 | Prdx1 | 103 | 0.851 | 0.0663 | Yes |
| 2 | Glrx2 | 472 | 0.599 | 0.0875 | Yes |
| 3 | Oxsr1 | 729 | 0.524 | 0.1117 | Yes |
| 4 | Txn1 | 809 | 0.504 | 0.1494 | Yes |
| 5 | Gpx4 | 822 | 0.502 | 0.1928 | Yes |
| 6 | Sod1 | 886 | 0.487 | 0.2304 | Yes |
| 7 | Mbp | 1244 | 0.421 | 0.2367 | Yes |
| 8 | G6pdx | 1360 | 0.406 | 0.2627 | Yes |
| 9 | Ndufs2 | 1596 | 0.371 | 0.2751 | Yes |
| 10 | Cdkn2d | 1623 | 0.366 | 0.3053 | Yes |
| 11 | Abcc1 | 1640 | 0.364 | 0.3361 | Yes |
| 12 | Msra | 2000 | 0.326 | 0.3339 | Yes |
| 13 | Ptpa | 2002 | 0.326 | 0.3626 | Yes |
| 14 | Mpo | 2129 | 0.310 | 0.3792 | Yes |
| 15 | Ercc2 | 2195 | 0.303 | 0.4003 | Yes |
| 16 | Gsr | 2828 | 0.242 | 0.3671 | No |
| 17 | Scaf4 | 2840 | 0.241 | 0.3874 | No |
| 18 | Hmox2 | 3224 | 0.208 | 0.3726 | No |
| 19 | Ndufa6 | 3517 | 0.182 | 0.3635 | No |
| 20 | Cat | 3524 | 0.182 | 0.3791 | No |
| 21 | Stk25 | 3865 | 0.153 | 0.3632 | No |
| 22 | Prdx2 | 4613 | 0.097 | 0.3072 | No |
| 23 | Glrx | 4739 | 0.088 | 0.3042 | No |
| 24 | Gclc | 4773 | 0.085 | 0.3089 | No |
| 25 | Txnrd2 | 4818 | 0.080 | 0.3122 | No |
| 26 | Prdx6 | 5265 | 0.047 | 0.2777 | No |
| 27 | Sbno2 | 5346 | 0.040 | 0.2743 | No |
| 28 | Egln2 | 5663 | 0.017 | 0.2485 | No |
| 29 | Selenos | 5754 | 0.009 | 0.2415 | No |
| 30 | Hhex | 6487 | -0.043 | 0.1820 | No |
| 31 | Ipcef1 | 6606 | -0.053 | 0.1765 | No |
| 32 | Prnp | 7121 | -0.096 | 0.1406 | No |
| 33 | Lsp1 | 7178 | -0.100 | 0.1446 | No |
| 34 | Gclm | 7281 | -0.106 | 0.1452 | No |
| 35 | Pfkp | 7688 | -0.136 | 0.1221 | No |
| 36 | Txnrd1 | 7689 | -0.136 | 0.1341 | No |
| 37 | Fes | 8311 | -0.189 | 0.0971 | No |
| 38 | Atox1 | 8832 | -0.235 | 0.0730 | No |
| 39 | Ftl1 | 8982 | -0.249 | 0.0821 | No |
| 40 | Pdlim1 | 10091 | -0.367 | 0.0188 | No |
| 41 | Sod2 | 10106 | -0.370 | 0.0503 | No |
| 42 | Lamtor5 | 10530 | -0.433 | 0.0520 | No |
| 43 | Junb | 10731 | -0.466 | 0.0759 | No |