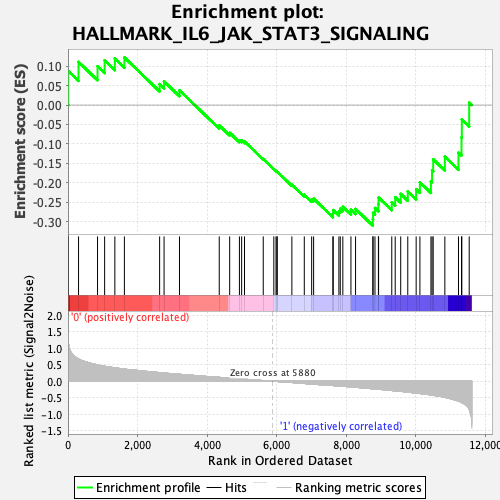
Profile of the Running ES Score & Positions of GeneSet Members on the Rank Ordered List
| Dataset | Eosinophil.Eosinophil_Pheno.cls #Group1_versus_Group2.Eosinophil_Pheno.cls #Group1_versus_Group2_repos |
| Phenotype | Eosinophil_Pheno.cls#Group1_versus_Group2_repos |
| Upregulated in class | 1 |
| GeneSet | HALLMARK_IL6_JAK_STAT3_SIGNALING |
| Enrichment Score (ES) | -0.3102503 |
| Normalized Enrichment Score (NES) | -1.165221 |
| Nominal p-value | 0.24390244 |
| FDR q-value | 0.45146182 |
| FWER p-Value | 0.962 |
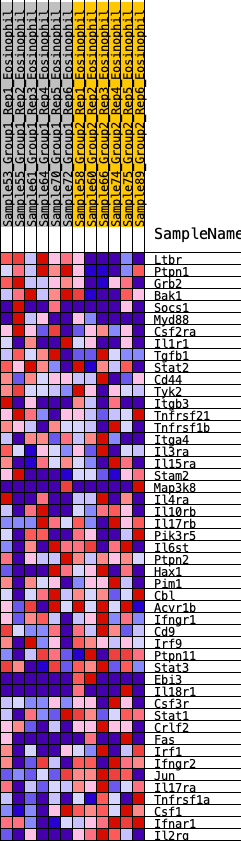
| SYMBOL | RANK IN GENE LIST | RANK METRIC SCORE | RUNNING ES | CORE ENRICHMENT | |
|---|---|---|---|---|---|
| 1 | Ltbr | 8 | 1.213 | 0.0876 | No |
| 2 | Ptpn1 | 303 | 0.671 | 0.1110 | No |
| 3 | Grb2 | 849 | 0.496 | 0.0999 | No |
| 4 | Bak1 | 1053 | 0.451 | 0.1152 | No |
| 5 | Socs1 | 1347 | 0.408 | 0.1195 | No |
| 6 | Myd88 | 1621 | 0.367 | 0.1225 | No |
| 7 | Csf2ra | 2634 | 0.260 | 0.0539 | No |
| 8 | Il1r1 | 2762 | 0.247 | 0.0609 | No |
| 9 | Tgfb1 | 3205 | 0.209 | 0.0379 | No |
| 10 | Stat2 | 4348 | 0.116 | -0.0525 | No |
| 11 | Cd44 | 4648 | 0.094 | -0.0715 | No |
| 12 | Tyk2 | 4928 | 0.071 | -0.0904 | No |
| 13 | Itgb3 | 4992 | 0.067 | -0.0910 | No |
| 14 | Tnfrsf21 | 5074 | 0.060 | -0.0936 | No |
| 15 | Tnfrsf1b | 5613 | 0.018 | -0.1388 | No |
| 16 | Itga4 | 5917 | -0.001 | -0.1650 | No |
| 17 | Il3ra | 5980 | -0.006 | -0.1699 | No |
| 18 | Il15ra | 6008 | -0.008 | -0.1717 | No |
| 19 | Stam2 | 6013 | -0.008 | -0.1714 | No |
| 20 | Map3k8 | 6436 | -0.039 | -0.2051 | No |
| 21 | Il4ra | 6793 | -0.069 | -0.2309 | No |
| 22 | Il10rb | 7005 | -0.087 | -0.2428 | No |
| 23 | Il17rb | 7061 | -0.091 | -0.2409 | No |
| 24 | Pik3r5 | 7616 | -0.131 | -0.2793 | No |
| 25 | Il6st | 7623 | -0.131 | -0.2703 | No |
| 26 | Ptpn2 | 7788 | -0.143 | -0.2740 | No |
| 27 | Hax1 | 7827 | -0.146 | -0.2666 | No |
| 28 | Pim1 | 7901 | -0.152 | -0.2619 | No |
| 29 | Cbl | 8134 | -0.172 | -0.2694 | No |
| 30 | Acvr1b | 8267 | -0.185 | -0.2673 | No |
| 31 | Ifngr1 | 8764 | -0.229 | -0.2936 | Yes |
| 32 | Cd9 | 8770 | -0.230 | -0.2772 | Yes |
| 33 | Irf9 | 8825 | -0.234 | -0.2649 | Yes |
| 34 | Ptpn11 | 8924 | -0.245 | -0.2555 | Yes |
| 35 | Stat3 | 8929 | -0.246 | -0.2380 | Yes |
| 36 | Ebi3 | 9308 | -0.283 | -0.2501 | Yes |
| 37 | Il18r1 | 9407 | -0.291 | -0.2374 | Yes |
| 38 | Csf3r | 9565 | -0.307 | -0.2286 | Yes |
| 39 | Stat1 | 9768 | -0.331 | -0.2220 | Yes |
| 40 | Crlf2 | 10009 | -0.360 | -0.2166 | Yes |
| 41 | Fas | 10117 | -0.371 | -0.1988 | Yes |
| 42 | Irf1 | 10434 | -0.415 | -0.1960 | Yes |
| 43 | Ifngr2 | 10466 | -0.421 | -0.1680 | Yes |
| 44 | Jun | 10499 | -0.428 | -0.1396 | Yes |
| 45 | Il17ra | 10834 | -0.490 | -0.1329 | Yes |
| 46 | Tnfrsf1a | 11226 | -0.606 | -0.1225 | Yes |
| 47 | Csf1 | 11313 | -0.641 | -0.0833 | Yes |
| 48 | Ifnar1 | 11322 | -0.647 | -0.0369 | Yes |
| 49 | Il2rg | 11534 | -0.847 | 0.0065 | Yes |