Profile of the Running ES Score & Positions of GeneSet Members on the Rank Ordered List
| Dataset | Eosinophil.Eosinophil_Pheno.cls #Group1_versus_Group2.Eosinophil_Pheno.cls #Group1_versus_Group2_repos |
| Phenotype | Eosinophil_Pheno.cls#Group1_versus_Group2_repos |
| Upregulated in class | 1 |
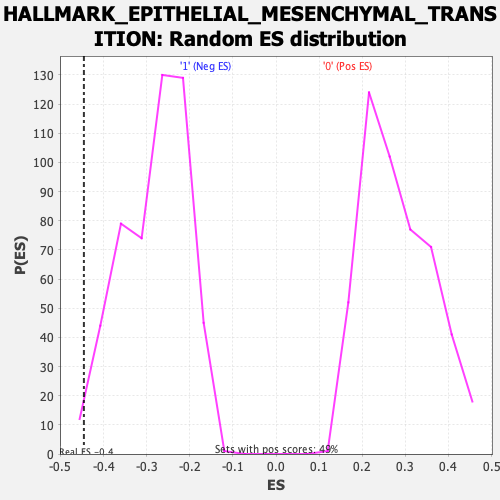
| GeneSet | HALLMARK_EPITHELIAL_MESENCHYMAL_TRANSITION |
| Enrichment Score (ES) | -0.445675 |
| Normalized Enrichment Score (NES) | -1.5794548 |
| Nominal p-value | 0.017509727 |
| FDR q-value | 0.08035218 |
| FWER p-Value | 0.145 |
| SYMBOL | RANK IN GENE LIST | RANK METRIC SCORE | RUNNING ES | CORE ENRICHMENT | |
|---|---|---|---|---|---|
| 1 | Itgav | 1062 | 0.449 | -0.0676 | No |
| 2 | Gadd45b | 1328 | 0.410 | -0.0684 | No |
| 3 | Pvr | 1631 | 0.366 | -0.0747 | No |
| 4 | Bmp1 | 1649 | 0.363 | -0.0565 | No |
| 5 | Basp1 | 1714 | 0.355 | -0.0429 | No |
| 6 | Gpc1 | 1721 | 0.354 | -0.0242 | No |
| 7 | Itgb1 | 1942 | 0.331 | -0.0253 | No |
| 8 | Plod1 | 2300 | 0.292 | -0.0404 | No |
| 9 | Tnfaip3 | 2398 | 0.280 | -0.0337 | No |
| 10 | Tgfb1 | 3205 | 0.209 | -0.0921 | No |
| 11 | Mcm7 | 3247 | 0.206 | -0.0845 | No |
| 12 | Plod3 | 3731 | 0.165 | -0.1174 | No |
| 13 | Rhob | 4463 | 0.108 | -0.1748 | No |
| 14 | Cd44 | 4648 | 0.094 | -0.1857 | No |
| 15 | Igfbp4 | 4853 | 0.077 | -0.1992 | No |
| 16 | Plod2 | 4910 | 0.073 | -0.2001 | No |
| 17 | Itgb3 | 4992 | 0.067 | -0.2035 | No |
| 18 | Fuca1 | 5079 | 0.060 | -0.2077 | No |
| 19 | Pmepa1 | 5241 | 0.048 | -0.2190 | No |
| 20 | Ppib | 5515 | 0.026 | -0.2413 | No |
| 21 | Ecm1 | 6431 | -0.039 | -0.3184 | No |
| 22 | Lgals1 | 6499 | -0.044 | -0.3218 | No |
| 23 | P3h1 | 6858 | -0.074 | -0.3488 | No |
| 24 | Mylk | 6884 | -0.077 | -0.3468 | No |
| 25 | Plaur | 7057 | -0.091 | -0.3567 | No |
| 26 | Ntm | 7118 | -0.096 | -0.3567 | No |
| 27 | Il15 | 7352 | -0.113 | -0.3708 | No |
| 28 | Gja1 | 7547 | -0.126 | -0.3808 | No |
| 29 | Itgb5 | 7590 | -0.130 | -0.3774 | No |
| 30 | Pdgfrb | 7952 | -0.158 | -0.4001 | No |
| 31 | Sntb1 | 8043 | -0.164 | -0.3990 | No |
| 32 | Thbs1 | 8090 | -0.168 | -0.3939 | No |
| 33 | Sat1 | 8214 | -0.180 | -0.3948 | No |
| 34 | Ecm2 | 8255 | -0.184 | -0.3883 | No |
| 35 | Calu | 8668 | -0.221 | -0.4120 | No |
| 36 | Copa | 8767 | -0.230 | -0.4080 | No |
| 37 | Emp3 | 8874 | -0.240 | -0.4042 | No |
| 38 | Glipr1 | 9175 | -0.270 | -0.4156 | No |
| 39 | Gadd45a | 9207 | -0.273 | -0.4035 | No |
| 40 | Colgalt1 | 9226 | -0.274 | -0.3902 | No |
| 41 | Tgfbr3 | 9868 | -0.343 | -0.4271 | Yes |
| 42 | Flna | 10024 | -0.361 | -0.4209 | Yes |
| 43 | Itga5 | 10047 | -0.363 | -0.4032 | Yes |
| 44 | Fas | 10117 | -0.371 | -0.3890 | Yes |
| 45 | Tpm4 | 10174 | -0.381 | -0.3733 | Yes |
| 46 | Vegfa | 10279 | -0.395 | -0.3609 | Yes |
| 47 | Jun | 10499 | -0.428 | -0.3566 | Yes |
| 48 | Notch2 | 10531 | -0.433 | -0.3358 | Yes |
| 49 | Vegfc | 10580 | -0.441 | -0.3161 | Yes |
| 50 | Dst | 10672 | -0.456 | -0.2993 | Yes |
| 51 | Vim | 10778 | -0.475 | -0.2826 | Yes |
| 52 | Wipf1 | 10874 | -0.498 | -0.2639 | Yes |
| 53 | Tpm1 | 10971 | -0.524 | -0.2438 | Yes |
| 54 | Vcam1 | 11005 | -0.534 | -0.2178 | Yes |
| 55 | Lamc1 | 11013 | -0.535 | -0.1894 | Yes |
| 56 | Itga2 | 11046 | -0.544 | -0.1627 | Yes |
| 57 | Tgfbi | 11060 | -0.549 | -0.1341 | Yes |
| 58 | Qsox1 | 11218 | -0.603 | -0.1150 | Yes |
| 59 | Sgcb | 11327 | -0.652 | -0.0891 | Yes |
| 60 | Serpine2 | 11345 | -0.660 | -0.0548 | Yes |
| 61 | Capg | 11609 | -1.432 | -0.0000 | Yes |