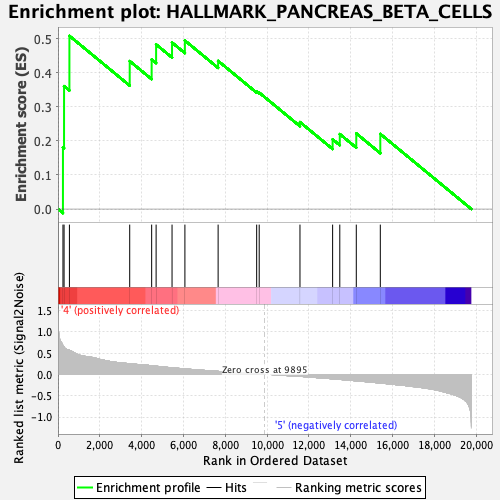
Profile of the Running ES Score & Positions of GeneSet Members on the Rank Ordered List
| Dataset | CMP.CMP_Pheno.cls#Group6_versus_Group8.CMP_Pheno.cls#Group6_versus_Group8_repos |
| Phenotype | CMP_Pheno.cls#Group6_versus_Group8_repos |
| Upregulated in class | 4 |
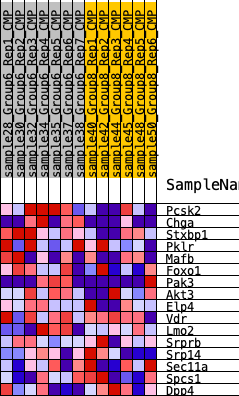
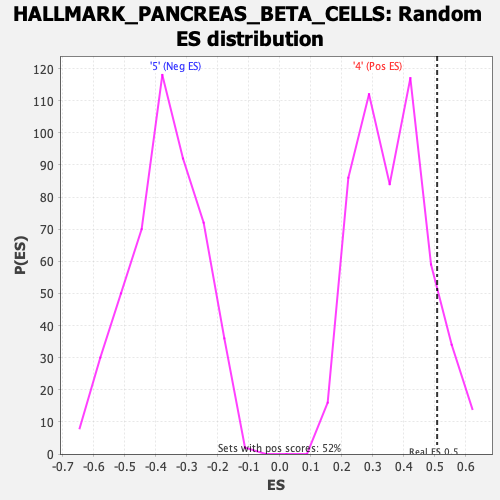
| GeneSet | HALLMARK_PANCREAS_BETA_CELLS |
| Enrichment Score (ES) | 0.50809276 |
| Normalized Enrichment Score (NES) | 1.3902404 |
| Nominal p-value | 0.10536399 |
| FDR q-value | 0.20953135 |
| FWER p-Value | 0.55 |
| SYMBOL | RANK IN GENE LIST | RANK METRIC SCORE | RUNNING ES | CORE ENRICHMENT | |
|---|---|---|---|---|---|
| 1 | Pcsk2 | 237 | 0.680 | 0.1810 | Yes |
| 2 | Chga | 290 | 0.641 | 0.3605 | Yes |
| 3 | Stxbp1 | 546 | 0.565 | 0.5081 | Yes |
| 4 | Pklr | 3430 | 0.253 | 0.4340 | No |
| 5 | Mafb | 4480 | 0.204 | 0.4389 | No |
| 6 | Foxo1 | 4693 | 0.193 | 0.4829 | No |
| 7 | Pak3 | 5455 | 0.155 | 0.4885 | No |
| 8 | Akt3 | 6070 | 0.130 | 0.4944 | No |
| 9 | Elp4 | 7659 | 0.072 | 0.4346 | No |
| 10 | Vdr | 9503 | 0.013 | 0.3450 | No |
| 11 | Lmo2 | 9624 | 0.009 | 0.3416 | No |
| 12 | Srprb | 11574 | -0.043 | 0.2551 | No |
| 13 | Srp14 | 13136 | -0.100 | 0.2046 | No |
| 14 | Sec11a | 13479 | -0.115 | 0.2199 | No |
| 15 | Spcs1 | 14268 | -0.147 | 0.2219 | No |
| 16 | Dpp4 | 15417 | -0.199 | 0.2204 | No |