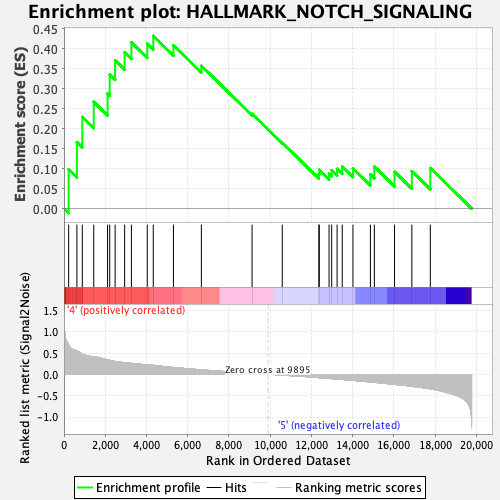
Profile of the Running ES Score & Positions of GeneSet Members on the Rank Ordered List
| Dataset | CMP.CMP_Pheno.cls#Group6_versus_Group8.CMP_Pheno.cls#Group6_versus_Group8_repos |
| Phenotype | CMP_Pheno.cls#Group6_versus_Group8_repos |
| Upregulated in class | 4 |
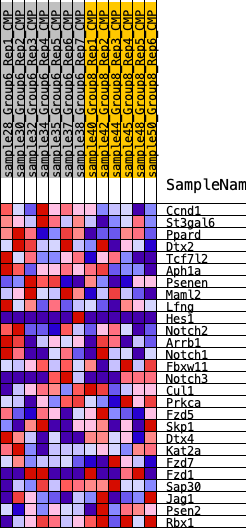
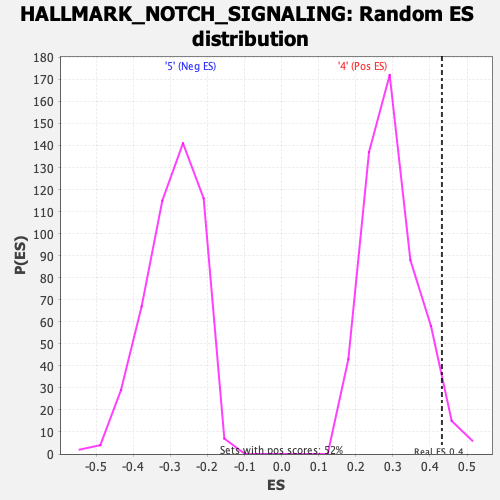
| GeneSet | HALLMARK_NOTCH_SIGNALING |
| Enrichment Score (ES) | 0.4323349 |
| Normalized Enrichment Score (NES) | 1.4617494 |
| Nominal p-value | 0.0327553 |
| FDR q-value | 0.25974563 |
| FWER p-Value | 0.418 |
| SYMBOL | RANK IN GENE LIST | RANK METRIC SCORE | RUNNING ES | CORE ENRICHMENT | |
|---|---|---|---|---|---|
| 1 | Ccnd1 | 226 | 0.689 | 0.0984 | Yes |
| 2 | St3gal6 | 625 | 0.552 | 0.1663 | Yes |
| 3 | Ppard | 888 | 0.479 | 0.2295 | Yes |
| 4 | Dtx2 | 1443 | 0.412 | 0.2672 | Yes |
| 5 | Tcf7l2 | 2113 | 0.342 | 0.2878 | Yes |
| 6 | Aph1a | 2217 | 0.332 | 0.3355 | Yes |
| 7 | Psenen | 2480 | 0.306 | 0.3710 | Yes |
| 8 | Maml2 | 2941 | 0.273 | 0.3913 | Yes |
| 9 | Lfng | 3269 | 0.259 | 0.4162 | Yes |
| 10 | Hes1 | 4038 | 0.225 | 0.4131 | Yes |
| 11 | Notch2 | 4330 | 0.213 | 0.4323 | Yes |
| 12 | Arrb1 | 5308 | 0.163 | 0.4089 | No |
| 13 | Notch1 | 6663 | 0.108 | 0.3575 | No |
| 14 | Fbxw11 | 9122 | 0.026 | 0.2371 | No |
| 15 | Notch3 | 10586 | -0.012 | 0.1650 | No |
| 16 | Cul1 | 12363 | -0.072 | 0.0864 | No |
| 17 | Prkca | 12380 | -0.072 | 0.0971 | No |
| 18 | Fzd5 | 12856 | -0.089 | 0.0872 | No |
| 19 | Skp1 | 12984 | -0.094 | 0.0958 | No |
| 20 | Dtx4 | 13246 | -0.105 | 0.0994 | No |
| 21 | Kat2a | 13495 | -0.115 | 0.1051 | No |
| 22 | Fzd7 | 14015 | -0.137 | 0.1006 | No |
| 23 | Fzd1 | 14861 | -0.174 | 0.0856 | No |
| 24 | Sap30 | 15053 | -0.184 | 0.1052 | No |
| 25 | Jag1 | 16032 | -0.230 | 0.0923 | No |
| 26 | Psen2 | 16872 | -0.275 | 0.0937 | No |
| 27 | Rbx1 | 17768 | -0.333 | 0.1014 | No |