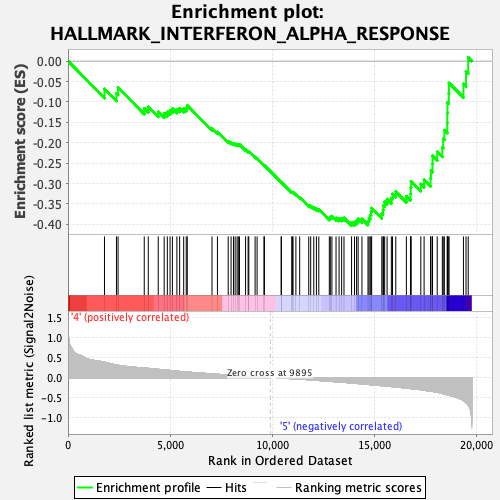
Profile of the Running ES Score & Positions of GeneSet Members on the Rank Ordered List
| Dataset | CMP.CMP_Pheno.cls#Group6_versus_Group8.CMP_Pheno.cls#Group6_versus_Group8_repos |
| Phenotype | CMP_Pheno.cls#Group6_versus_Group8_repos |
| Upregulated in class | 5 |
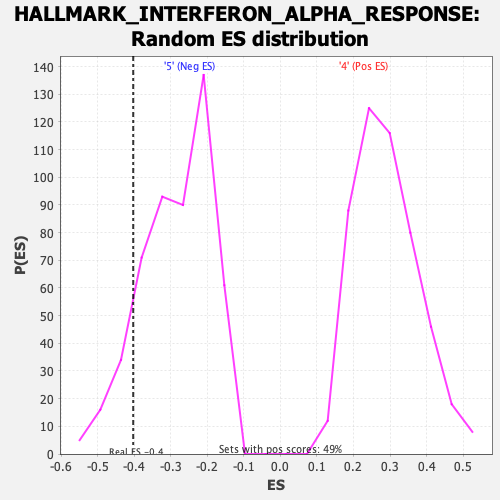
| GeneSet | HALLMARK_INTERFERON_ALPHA_RESPONSE |
| Enrichment Score (ES) | -0.40290034 |
| Normalized Enrichment Score (NES) | -1.4060329 |
| Nominal p-value | 0.11637081 |
| FDR q-value | 0.21248396 |
| FWER p-Value | 0.516 |
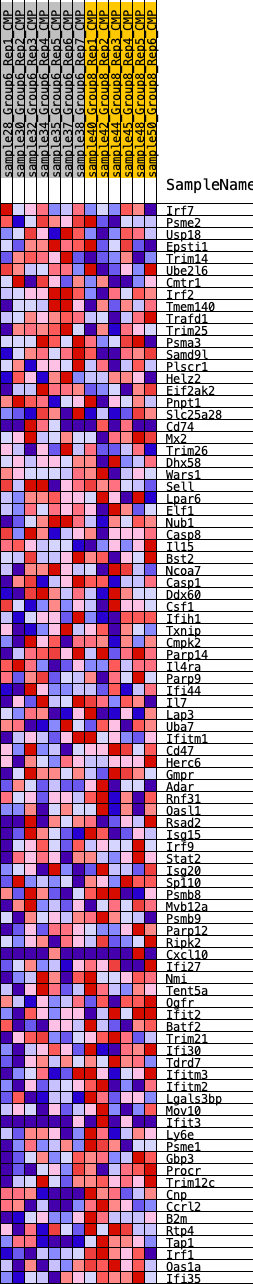
| SYMBOL | RANK IN GENE LIST | RANK METRIC SCORE | RUNNING ES | CORE ENRICHMENT | |
|---|---|---|---|---|---|
| 1 | Irf7 | 1786 | 0.383 | -0.0680 | No |
| 2 | Psme2 | 2372 | 0.316 | -0.0790 | No |
| 3 | Usp18 | 2451 | 0.309 | -0.0647 | No |
| 4 | Epsti1 | 3733 | 0.238 | -0.1156 | No |
| 5 | Trim14 | 3930 | 0.230 | -0.1119 | No |
| 6 | Ube2l6 | 4418 | 0.207 | -0.1244 | No |
| 7 | Cmtr1 | 4708 | 0.192 | -0.1277 | No |
| 8 | Irf2 | 4863 | 0.185 | -0.1246 | No |
| 9 | Tmem140 | 4997 | 0.178 | -0.1207 | No |
| 10 | Trafd1 | 5112 | 0.173 | -0.1163 | No |
| 11 | Trim25 | 5331 | 0.161 | -0.1178 | No |
| 12 | Psma3 | 5466 | 0.155 | -0.1154 | No |
| 13 | Samd9l | 5664 | 0.148 | -0.1167 | No |
| 14 | Plscr1 | 5789 | 0.142 | -0.1145 | No |
| 15 | Helz2 | 5839 | 0.140 | -0.1087 | No |
| 16 | Eif2ak2 | 7051 | 0.094 | -0.1647 | No |
| 17 | Pnpt1 | 7317 | 0.084 | -0.1732 | No |
| 18 | Slc25a28 | 7844 | 0.067 | -0.1959 | No |
| 19 | Cd74 | 7984 | 0.062 | -0.1993 | No |
| 20 | Mx2 | 8102 | 0.059 | -0.2018 | No |
| 21 | Trim26 | 8183 | 0.056 | -0.2025 | No |
| 22 | Dhx58 | 8278 | 0.052 | -0.2042 | No |
| 23 | Wars1 | 8339 | 0.051 | -0.2042 | No |
| 24 | Sell | 8396 | 0.050 | -0.2042 | No |
| 25 | Lpar6 | 8694 | 0.040 | -0.2169 | No |
| 26 | Elf1 | 8819 | 0.035 | -0.2211 | No |
| 27 | Nub1 | 8852 | 0.034 | -0.2207 | No |
| 28 | Casp8 | 9161 | 0.024 | -0.2349 | No |
| 29 | Il15 | 9258 | 0.021 | -0.2385 | No |
| 30 | Bst2 | 9593 | 0.010 | -0.2549 | No |
| 31 | Ncoa7 | 9618 | 0.010 | -0.2555 | No |
| 32 | Casp1 | 10436 | -0.007 | -0.2966 | No |
| 33 | Ddx60 | 10448 | -0.007 | -0.2968 | No |
| 34 | Csf1 | 10955 | -0.024 | -0.3211 | No |
| 35 | Ifih1 | 10987 | -0.025 | -0.3211 | No |
| 36 | Txnip | 11018 | -0.026 | -0.3211 | No |
| 37 | Cmpk2 | 11158 | -0.031 | -0.3263 | No |
| 38 | Parp14 | 11343 | -0.037 | -0.3335 | No |
| 39 | Il4ra | 11788 | -0.050 | -0.3531 | No |
| 40 | Parp9 | 11882 | -0.054 | -0.3546 | No |
| 41 | Ifi44 | 12033 | -0.060 | -0.3587 | No |
| 42 | Il7 | 12162 | -0.064 | -0.3614 | No |
| 43 | Lap3 | 12280 | -0.069 | -0.3633 | No |
| 44 | Uba7 | 12794 | -0.087 | -0.3842 | No |
| 45 | Ifitm1 | 12843 | -0.088 | -0.3814 | No |
| 46 | Cd47 | 12921 | -0.091 | -0.3799 | No |
| 47 | Herc6 | 13123 | -0.100 | -0.3842 | No |
| 48 | Gmpr | 13272 | -0.106 | -0.3854 | No |
| 49 | Adar | 13398 | -0.111 | -0.3852 | No |
| 50 | Rnf31 | 13513 | -0.116 | -0.3841 | No |
| 51 | Oasl1 | 13884 | -0.131 | -0.3951 | Yes |
| 52 | Rsad2 | 14027 | -0.137 | -0.3942 | Yes |
| 53 | Isg15 | 14130 | -0.141 | -0.3910 | Yes |
| 54 | Irf9 | 14206 | -0.145 | -0.3862 | Yes |
| 55 | Stat2 | 14392 | -0.153 | -0.3866 | Yes |
| 56 | Isg20 | 14688 | -0.166 | -0.3917 | Yes |
| 57 | Sp110 | 14738 | -0.169 | -0.3842 | Yes |
| 58 | Psmb8 | 14795 | -0.171 | -0.3769 | Yes |
| 59 | Mvb12a | 14839 | -0.173 | -0.3689 | Yes |
| 60 | Psmb9 | 14867 | -0.174 | -0.3599 | Yes |
| 61 | Parp12 | 15365 | -0.197 | -0.3735 | Yes |
| 62 | Ripk2 | 15423 | -0.200 | -0.3645 | Yes |
| 63 | Cxcl10 | 15445 | -0.201 | -0.3537 | Yes |
| 64 | Ifi27 | 15504 | -0.204 | -0.3446 | Yes |
| 65 | Nmi | 15624 | -0.209 | -0.3382 | Yes |
| 66 | Tent5a | 15831 | -0.219 | -0.3357 | Yes |
| 67 | Ogfr | 15889 | -0.222 | -0.3254 | Yes |
| 68 | Ifit2 | 16048 | -0.231 | -0.3197 | Yes |
| 69 | Batf2 | 16567 | -0.256 | -0.3309 | Yes |
| 70 | Trim21 | 16771 | -0.269 | -0.3252 | Yes |
| 71 | Ifi30 | 16780 | -0.269 | -0.3097 | Yes |
| 72 | Tdrd7 | 16798 | -0.271 | -0.2945 | Yes |
| 73 | Ifitm3 | 17274 | -0.297 | -0.3010 | Yes |
| 74 | Ifitm2 | 17435 | -0.310 | -0.2908 | Yes |
| 75 | Lgals3bp | 17752 | -0.331 | -0.2872 | Yes |
| 76 | Mov10 | 17771 | -0.333 | -0.2683 | Yes |
| 77 | Ifit3 | 17844 | -0.340 | -0.2519 | Yes |
| 78 | Ly6e | 17848 | -0.340 | -0.2318 | Yes |
| 79 | Psme1 | 18077 | -0.361 | -0.2220 | Yes |
| 80 | Gbp3 | 18328 | -0.390 | -0.2116 | Yes |
| 81 | Procr | 18370 | -0.395 | -0.1903 | Yes |
| 82 | Trim12c | 18427 | -0.404 | -0.1692 | Yes |
| 83 | Cnp | 18570 | -0.423 | -0.1513 | Yes |
| 84 | Ccrl2 | 18574 | -0.423 | -0.1263 | Yes |
| 85 | B2m | 18580 | -0.424 | -0.1015 | Yes |
| 86 | Rtp4 | 18643 | -0.433 | -0.0789 | Yes |
| 87 | Tap1 | 18651 | -0.434 | -0.0536 | Yes |
| 88 | Irf1 | 19361 | -0.565 | -0.0561 | Yes |
| 89 | Oas1a | 19487 | -0.618 | -0.0258 | Yes |
| 90 | Ifi35 | 19595 | -0.677 | 0.0089 | Yes |