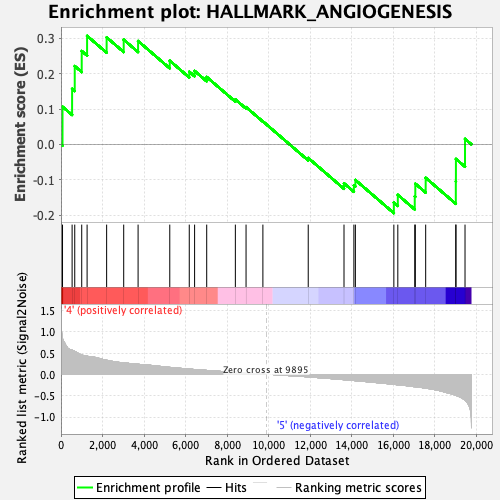
Profile of the Running ES Score & Positions of GeneSet Members on the Rank Ordered List
| Dataset | CMP.CMP_Pheno.cls#Group6_versus_Group8.CMP_Pheno.cls#Group6_versus_Group8_repos |
| Phenotype | CMP_Pheno.cls#Group6_versus_Group8_repos |
| Upregulated in class | 4 |
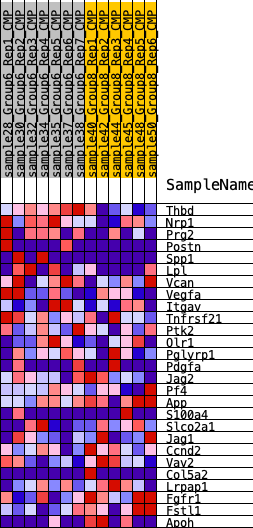
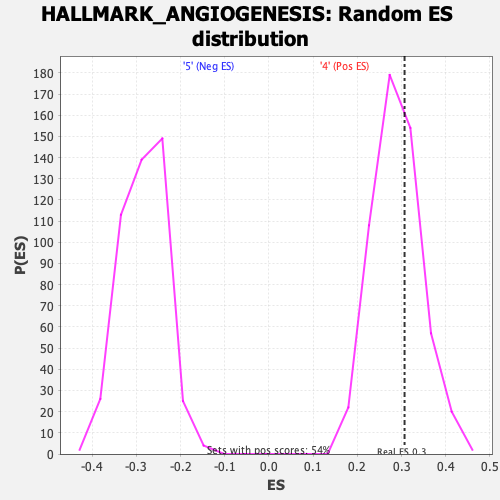
| GeneSet | HALLMARK_ANGIOGENESIS |
| Enrichment Score (ES) | 0.3068669 |
| Normalized Enrichment Score (NES) | 1.0611427 |
| Nominal p-value | 0.36715868 |
| FDR q-value | 0.5898216 |
| FWER p-Value | 0.978 |
| SYMBOL | RANK IN GENE LIST | RANK METRIC SCORE | RUNNING ES | CORE ENRICHMENT | |
|---|---|---|---|---|---|
| 1 | Thbd | 73 | 0.846 | 0.1066 | Yes |
| 2 | Nrp1 | 535 | 0.568 | 0.1573 | Yes |
| 3 | Prg2 | 662 | 0.542 | 0.2215 | Yes |
| 4 | Postn | 998 | 0.456 | 0.2641 | Yes |
| 5 | Spp1 | 1257 | 0.429 | 0.3069 | Yes |
| 6 | Lpl | 2198 | 0.333 | 0.3027 | No |
| 7 | Vcan | 3020 | 0.269 | 0.2961 | No |
| 8 | Vegfa | 3713 | 0.239 | 0.2923 | No |
| 9 | Itgav | 5239 | 0.166 | 0.2367 | No |
| 10 | Tnfrsf21 | 6178 | 0.126 | 0.2056 | No |
| 11 | Ptk2 | 6435 | 0.116 | 0.2078 | No |
| 12 | Olr1 | 7018 | 0.095 | 0.1907 | No |
| 13 | Pglyrp1 | 8398 | 0.049 | 0.1273 | No |
| 14 | Pdgfa | 8913 | 0.032 | 0.1055 | No |
| 15 | Jag2 | 9724 | 0.006 | 0.0652 | No |
| 16 | Pf4 | 11908 | -0.055 | -0.0382 | No |
| 17 | App | 13631 | -0.120 | -0.1098 | No |
| 18 | S100a4 | 14107 | -0.141 | -0.1155 | No |
| 19 | Slco2a1 | 14179 | -0.144 | -0.1004 | No |
| 20 | Jag1 | 16032 | -0.230 | -0.1642 | No |
| 21 | Ccnd2 | 16223 | -0.241 | -0.1425 | No |
| 22 | Vav2 | 17039 | -0.283 | -0.1468 | No |
| 23 | Col5a2 | 17066 | -0.285 | -0.1109 | No |
| 24 | Lrpap1 | 17565 | -0.320 | -0.0943 | No |
| 25 | Fgfr1 | 19017 | -0.487 | -0.1044 | No |
| 26 | Fstl1 | 19022 | -0.488 | -0.0409 | No |
| 27 | Apoh | 19460 | -0.605 | 0.0158 | No |