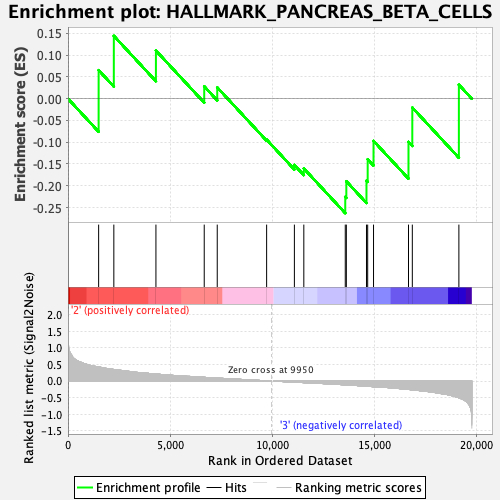
Profile of the Running ES Score & Positions of GeneSet Members on the Rank Ordered List
| Dataset | CMP.CMP_Pheno.cls#Group3_versus_Group4.CMP_Pheno.cls#Group3_versus_Group4_repos |
| Phenotype | CMP_Pheno.cls#Group3_versus_Group4_repos |
| Upregulated in class | 3 |
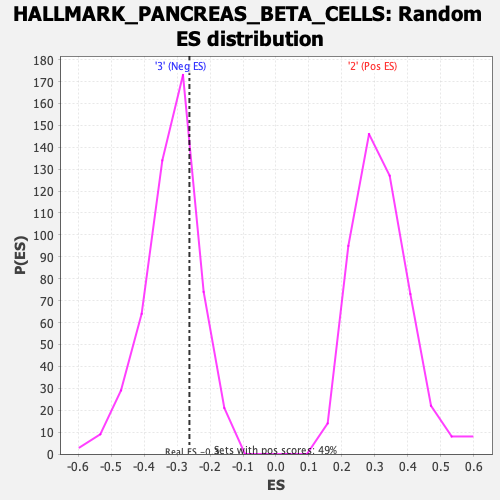
| GeneSet | HALLMARK_PANCREAS_BETA_CELLS |
| Enrichment Score (ES) | -0.2629506 |
| Normalized Enrichment Score (NES) | -0.82804847 |
| Nominal p-value | 0.7337278 |
| FDR q-value | 1.0 |
| FWER p-Value | 0.999 |
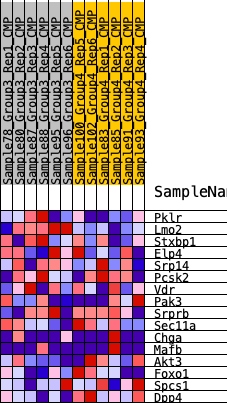
| SYMBOL | RANK IN GENE LIST | RANK METRIC SCORE | RUNNING ES | CORE ENRICHMENT | |
|---|---|---|---|---|---|
| 1 | Pklr | 1500 | 0.421 | 0.0655 | No |
| 2 | Lmo2 | 2244 | 0.347 | 0.1444 | No |
| 3 | Stxbp1 | 4305 | 0.210 | 0.1105 | No |
| 4 | Elp4 | 6670 | 0.112 | 0.0283 | No |
| 5 | Srp14 | 7307 | 0.088 | 0.0258 | No |
| 6 | Pcsk2 | 9725 | 0.007 | -0.0940 | No |
| 7 | Vdr | 11084 | -0.032 | -0.1522 | No |
| 8 | Pak3 | 11546 | -0.045 | -0.1603 | No |
| 9 | Srprb | 13575 | -0.112 | -0.2253 | Yes |
| 10 | Sec11a | 13628 | -0.114 | -0.1898 | Yes |
| 11 | Chga | 14614 | -0.153 | -0.1883 | Yes |
| 12 | Mafb | 14673 | -0.155 | -0.1392 | Yes |
| 13 | Akt3 | 14959 | -0.169 | -0.0970 | Yes |
| 14 | Foxo1 | 16671 | -0.252 | -0.0992 | Yes |
| 15 | Spcs1 | 16858 | -0.263 | -0.0204 | Yes |
| 16 | Dpp4 | 19138 | -0.500 | 0.0320 | Yes |