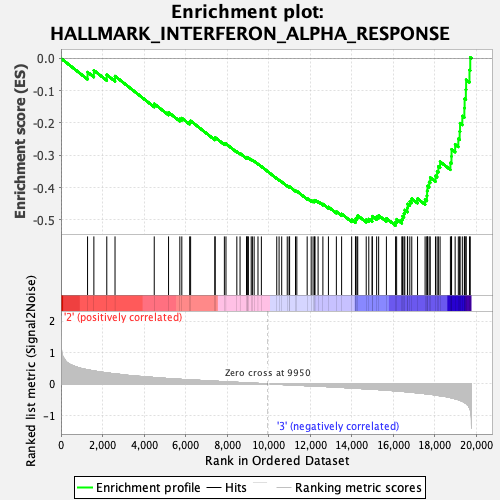
Profile of the Running ES Score & Positions of GeneSet Members on the Rank Ordered List
| Dataset | CMP.CMP_Pheno.cls#Group3_versus_Group4.CMP_Pheno.cls#Group3_versus_Group4_repos |
| Phenotype | CMP_Pheno.cls#Group3_versus_Group4_repos |
| Upregulated in class | 3 |
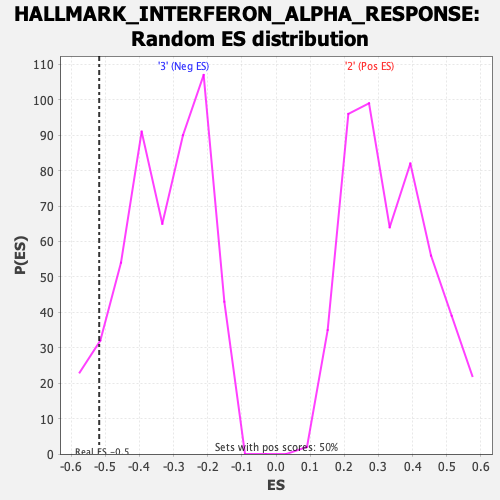
| GeneSet | HALLMARK_INTERFERON_ALPHA_RESPONSE |
| Enrichment Score (ES) | -0.5179046 |
| Normalized Enrichment Score (NES) | -1.5800325 |
| Nominal p-value | 0.06534653 |
| FDR q-value | 0.25740528 |
| FWER p-Value | 0.268 |
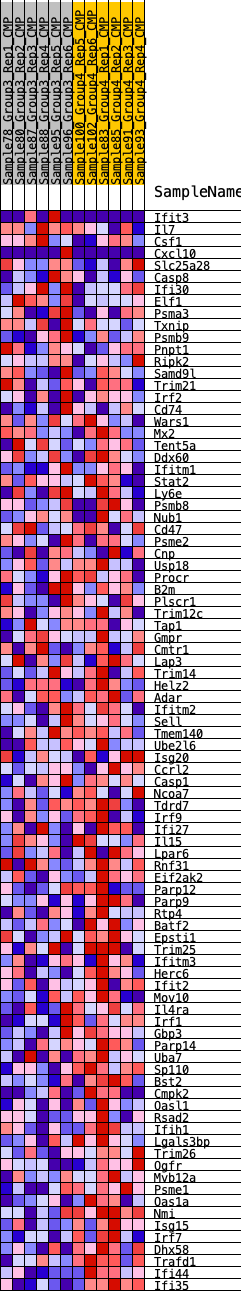
| SYMBOL | RANK IN GENE LIST | RANK METRIC SCORE | RUNNING ES | CORE ENRICHMENT | |
|---|---|---|---|---|---|
| 1 | Ifit3 | 1279 | 0.445 | -0.0425 | No |
| 2 | Il7 | 1583 | 0.414 | -0.0370 | No |
| 3 | Csf1 | 2205 | 0.351 | -0.0509 | No |
| 4 | Cxcl10 | 2602 | 0.320 | -0.0549 | No |
| 5 | Slc25a28 | 4491 | 0.201 | -0.1406 | No |
| 6 | Casp8 | 5180 | 0.168 | -0.1671 | No |
| 7 | Ifi30 | 5724 | 0.145 | -0.1874 | No |
| 8 | Elf1 | 5819 | 0.141 | -0.1851 | No |
| 9 | Psma3 | 6197 | 0.130 | -0.1977 | No |
| 10 | Txnip | 6243 | 0.128 | -0.1935 | No |
| 11 | Psmb9 | 7409 | 0.085 | -0.2484 | No |
| 12 | Pnpt1 | 7426 | 0.084 | -0.2450 | No |
| 13 | Ripk2 | 7869 | 0.069 | -0.2639 | No |
| 14 | Samd9l | 7946 | 0.066 | -0.2645 | No |
| 15 | Trim21 | 8469 | 0.049 | -0.2885 | No |
| 16 | Irf2 | 8624 | 0.043 | -0.2941 | No |
| 17 | Cd74 | 8935 | 0.033 | -0.3082 | No |
| 18 | Wars1 | 8961 | 0.032 | -0.3079 | No |
| 19 | Mx2 | 8994 | 0.031 | -0.3080 | No |
| 20 | Tent5a | 9025 | 0.030 | -0.3080 | No |
| 21 | Ddx60 | 9161 | 0.025 | -0.3136 | No |
| 22 | Ifitm1 | 9219 | 0.023 | -0.3153 | No |
| 23 | Stat2 | 9303 | 0.021 | -0.3185 | No |
| 24 | Ly6e | 9488 | 0.015 | -0.3271 | No |
| 25 | Psmb8 | 9651 | 0.010 | -0.3348 | No |
| 26 | Nub1 | 10392 | -0.009 | -0.3719 | No |
| 27 | Cd47 | 10504 | -0.013 | -0.3769 | No |
| 28 | Psme2 | 10630 | -0.017 | -0.3824 | No |
| 29 | Cnp | 10897 | -0.025 | -0.3946 | No |
| 30 | Usp18 | 10984 | -0.028 | -0.3976 | No |
| 31 | Procr | 11011 | -0.029 | -0.3974 | No |
| 32 | B2m | 11295 | -0.038 | -0.4099 | No |
| 33 | Plscr1 | 11359 | -0.040 | -0.4111 | No |
| 34 | Trim12c | 11857 | -0.055 | -0.4336 | No |
| 35 | Tap1 | 12050 | -0.062 | -0.4402 | No |
| 36 | Gmpr | 12141 | -0.065 | -0.4415 | No |
| 37 | Cmtr1 | 12209 | -0.067 | -0.4415 | No |
| 38 | Lap3 | 12235 | -0.068 | -0.4394 | No |
| 39 | Trim14 | 12383 | -0.071 | -0.4432 | No |
| 40 | Helz2 | 12614 | -0.078 | -0.4510 | No |
| 41 | Adar | 12881 | -0.086 | -0.4602 | No |
| 42 | Ifitm2 | 13263 | -0.101 | -0.4744 | No |
| 43 | Sell | 13516 | -0.110 | -0.4817 | No |
| 44 | Tmem140 | 14000 | -0.128 | -0.4998 | No |
| 45 | Ube2l6 | 14183 | -0.136 | -0.5022 | No |
| 46 | Isg20 | 14197 | -0.136 | -0.4960 | No |
| 47 | Ccrl2 | 14255 | -0.139 | -0.4919 | No |
| 48 | Casp1 | 14292 | -0.140 | -0.4867 | No |
| 49 | Ncoa7 | 14701 | -0.156 | -0.4995 | No |
| 50 | Tdrd7 | 14825 | -0.163 | -0.4976 | No |
| 51 | Irf9 | 14988 | -0.170 | -0.4972 | No |
| 52 | Ifi27 | 14992 | -0.170 | -0.4888 | No |
| 53 | Il15 | 15203 | -0.175 | -0.4906 | No |
| 54 | Lpar6 | 15300 | -0.179 | -0.4865 | No |
| 55 | Rnf31 | 15673 | -0.196 | -0.4955 | No |
| 56 | Eif2ak2 | 16115 | -0.219 | -0.5068 | Yes |
| 57 | Parp12 | 16166 | -0.223 | -0.4981 | Yes |
| 58 | Parp9 | 16417 | -0.235 | -0.4990 | Yes |
| 59 | Rtp4 | 16451 | -0.237 | -0.4887 | Yes |
| 60 | Batf2 | 16519 | -0.242 | -0.4799 | Yes |
| 61 | Epsti1 | 16559 | -0.243 | -0.4696 | Yes |
| 62 | Trim25 | 16685 | -0.252 | -0.4633 | Yes |
| 63 | Ifitm3 | 16696 | -0.253 | -0.4510 | Yes |
| 64 | Herc6 | 16801 | -0.260 | -0.4432 | Yes |
| 65 | Ifit2 | 16895 | -0.265 | -0.4346 | Yes |
| 66 | Mov10 | 17173 | -0.283 | -0.4344 | Yes |
| 67 | Il4ra | 17537 | -0.308 | -0.4373 | Yes |
| 68 | Irf1 | 17623 | -0.315 | -0.4257 | Yes |
| 69 | Gbp3 | 17634 | -0.316 | -0.4103 | Yes |
| 70 | Parp14 | 17654 | -0.317 | -0.3952 | Yes |
| 71 | Uba7 | 17731 | -0.322 | -0.3829 | Yes |
| 72 | Sp110 | 17785 | -0.327 | -0.3691 | Yes |
| 73 | Bst2 | 18037 | -0.351 | -0.3641 | Yes |
| 74 | Cmpk2 | 18115 | -0.358 | -0.3500 | Yes |
| 75 | Oasl1 | 18176 | -0.365 | -0.3346 | Yes |
| 76 | Rsad2 | 18259 | -0.375 | -0.3199 | Yes |
| 77 | Ifih1 | 18756 | -0.432 | -0.3233 | Yes |
| 78 | Lgals3bp | 18807 | -0.440 | -0.3036 | Yes |
| 79 | Trim26 | 18812 | -0.441 | -0.2816 | Yes |
| 80 | Ogfr | 18984 | -0.472 | -0.2665 | Yes |
| 81 | Mvb12a | 19137 | -0.500 | -0.2490 | Yes |
| 82 | Psme1 | 19202 | -0.517 | -0.2262 | Yes |
| 83 | Oas1a | 19221 | -0.523 | -0.2007 | Yes |
| 84 | Nmi | 19330 | -0.549 | -0.1785 | Yes |
| 85 | Isg15 | 19428 | -0.583 | -0.1540 | Yes |
| 86 | Irf7 | 19441 | -0.587 | -0.1250 | Yes |
| 87 | Dhx58 | 19501 | -0.615 | -0.0970 | Yes |
| 88 | Trafd1 | 19513 | -0.622 | -0.0661 | Yes |
| 89 | Ifi44 | 19675 | -0.757 | -0.0361 | Yes |
| 90 | Ifi35 | 19712 | -0.812 | 0.0030 | Yes |