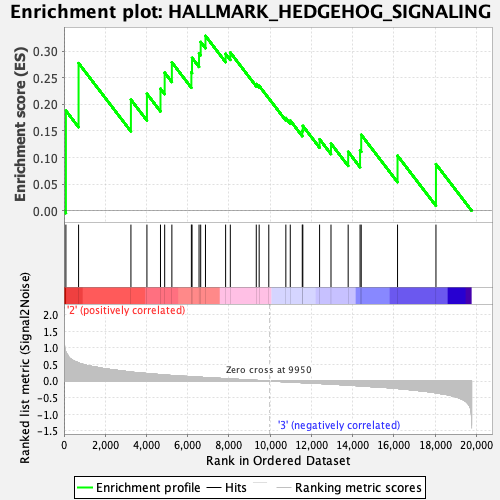
Profile of the Running ES Score & Positions of GeneSet Members on the Rank Ordered List
| Dataset | CMP.CMP_Pheno.cls#Group3_versus_Group4.CMP_Pheno.cls#Group3_versus_Group4_repos |
| Phenotype | CMP_Pheno.cls#Group3_versus_Group4_repos |
| Upregulated in class | 2 |
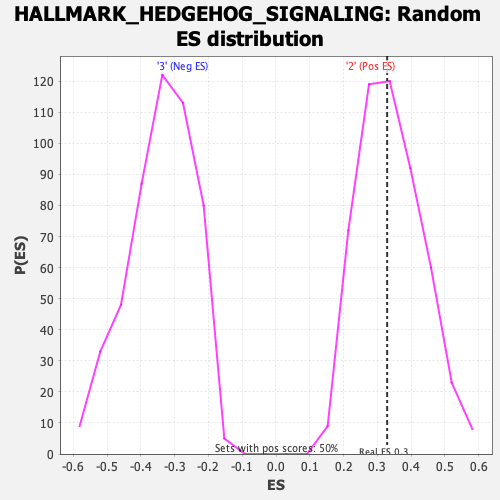
| GeneSet | HALLMARK_HEDGEHOG_SIGNALING |
| Enrichment Score (ES) | 0.32899052 |
| Normalized Enrichment Score (NES) | 0.97558415 |
| Nominal p-value | 0.48508945 |
| FDR q-value | 0.79918474 |
| FWER p-Value | 0.989 |
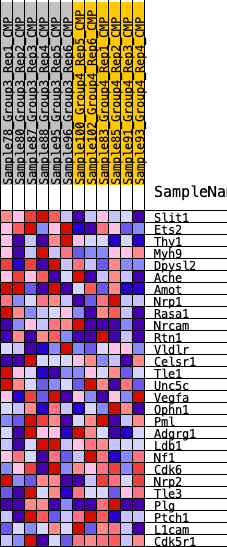
| SYMBOL | RANK IN GENE LIST | RANK METRIC SCORE | RUNNING ES | CORE ENRICHMENT | |
|---|---|---|---|---|---|
| 1 | Slit1 | 92 | 0.865 | 0.1882 | Yes |
| 2 | Ets2 | 707 | 0.541 | 0.2777 | Yes |
| 3 | Thy1 | 3246 | 0.268 | 0.2089 | Yes |
| 4 | Myh9 | 4022 | 0.226 | 0.2200 | Yes |
| 5 | Dpysl2 | 4680 | 0.192 | 0.2296 | Yes |
| 6 | Ache | 4883 | 0.181 | 0.2597 | Yes |
| 7 | Amot | 5232 | 0.166 | 0.2792 | Yes |
| 8 | Nrp1 | 6178 | 0.131 | 0.2604 | Yes |
| 9 | Rasa1 | 6210 | 0.129 | 0.2877 | Yes |
| 10 | Nrcam | 6550 | 0.116 | 0.2964 | Yes |
| 11 | Rtn1 | 6630 | 0.113 | 0.3175 | Yes |
| 12 | Vldlr | 6862 | 0.104 | 0.3290 | Yes |
| 13 | Celsr1 | 7839 | 0.070 | 0.2952 | No |
| 14 | Tle1 | 8067 | 0.063 | 0.2977 | No |
| 15 | Unc5c | 9326 | 0.020 | 0.2384 | No |
| 16 | Vegfa | 9466 | 0.016 | 0.2349 | No |
| 17 | Ophn1 | 9933 | 0.001 | 0.2114 | No |
| 18 | Pml | 10760 | -0.021 | 0.1743 | No |
| 19 | Adgrg1 | 10975 | -0.028 | 0.1696 | No |
| 20 | Ldb1 | 11557 | -0.046 | 0.1505 | No |
| 21 | Nf1 | 11584 | -0.047 | 0.1596 | No |
| 22 | Cdk6 | 12397 | -0.071 | 0.1344 | No |
| 23 | Nrp2 | 12950 | -0.089 | 0.1263 | No |
| 24 | Tle3 | 13783 | -0.120 | 0.1109 | No |
| 25 | Plg | 14360 | -0.142 | 0.1135 | No |
| 26 | Ptch1 | 14416 | -0.144 | 0.1429 | No |
| 27 | L1cam | 16178 | -0.223 | 0.1034 | No |
| 28 | Cdk5r1 | 18041 | -0.352 | 0.0876 | No |