Profile of the Running ES Score & Positions of GeneSet Members on the Rank Ordered List
| Dataset | CMP.CMP_Pheno.cls#Group3_versus_Group4.CMP_Pheno.cls#Group3_versus_Group4_repos |
| Phenotype | CMP_Pheno.cls#Group3_versus_Group4_repos |
| Upregulated in class | 2 |
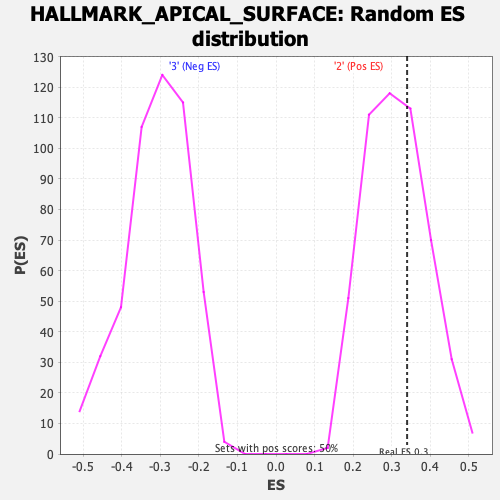
| GeneSet | HALLMARK_APICAL_SURFACE |
| Enrichment Score (ES) | 0.34007776 |
| Normalized Enrichment Score (NES) | 1.0944542 |
| Nominal p-value | 0.36978132 |
| FDR q-value | 0.86982334 |
| FWER p-Value | 0.931 |
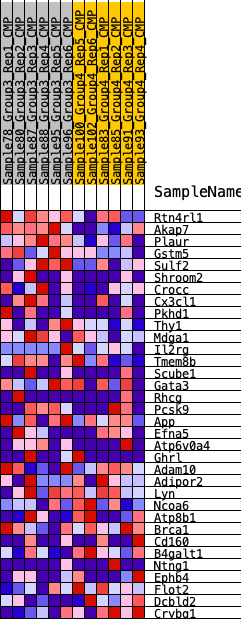
| SYMBOL | RANK IN GENE LIST | RANK METRIC SCORE | RUNNING ES | CORE ENRICHMENT | |
|---|---|---|---|---|---|
| 1 | Rtn4rl1 | 229 | 0.720 | 0.0611 | Yes |
| 2 | Akap7 | 266 | 0.694 | 0.1293 | Yes |
| 3 | Plaur | 493 | 0.600 | 0.1784 | Yes |
| 4 | Gstm5 | 657 | 0.558 | 0.2264 | Yes |
| 5 | Sulf2 | 1131 | 0.466 | 0.2495 | Yes |
| 6 | Shroom2 | 1451 | 0.427 | 0.2763 | Yes |
| 7 | Crocc | 1735 | 0.394 | 0.3017 | Yes |
| 8 | Cx3cl1 | 2273 | 0.343 | 0.3092 | Yes |
| 9 | Pkhd1 | 2472 | 0.328 | 0.3322 | Yes |
| 10 | Thy1 | 3246 | 0.268 | 0.3201 | Yes |
| 11 | Mdga1 | 3489 | 0.255 | 0.3336 | Yes |
| 12 | Il2rg | 3833 | 0.237 | 0.3401 | Yes |
| 13 | Tmem8b | 4579 | 0.197 | 0.3222 | No |
| 14 | Scube1 | 4811 | 0.185 | 0.3292 | No |
| 15 | Gata3 | 5852 | 0.139 | 0.2906 | No |
| 16 | Rhcg | 6288 | 0.127 | 0.2813 | No |
| 17 | Pcsk9 | 6332 | 0.126 | 0.2918 | No |
| 18 | App | 6993 | 0.100 | 0.2685 | No |
| 19 | Efna5 | 7510 | 0.081 | 0.2505 | No |
| 20 | Atp6v0a4 | 8191 | 0.058 | 0.2220 | No |
| 21 | Ghrl | 9654 | 0.010 | 0.1489 | No |
| 22 | Adam10 | 10546 | -0.015 | 0.1052 | No |
| 23 | Adipor2 | 11439 | -0.042 | 0.0643 | No |
| 24 | Lyn | 12542 | -0.076 | 0.0161 | No |
| 25 | Ncoa6 | 15550 | -0.190 | -0.1171 | No |
| 26 | Atp8b1 | 16046 | -0.215 | -0.1205 | No |
| 27 | Brca1 | 16123 | -0.220 | -0.1021 | No |
| 28 | Cd160 | 16737 | -0.255 | -0.1074 | No |
| 29 | B4galt1 | 16819 | -0.260 | -0.0853 | No |
| 30 | Ntng1 | 17024 | -0.272 | -0.0682 | No |
| 31 | Ephb4 | 18032 | -0.351 | -0.0838 | No |
| 32 | Flot2 | 19170 | -0.509 | -0.0900 | No |
| 33 | Dcbld2 | 19454 | -0.595 | -0.0443 | No |
| 34 | Crybg1 | 19465 | -0.598 | 0.0155 | No |