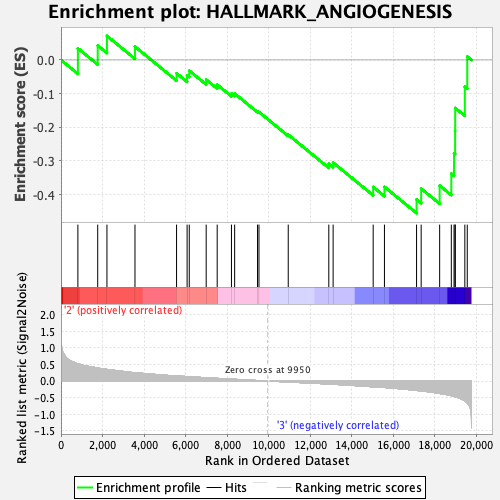
Profile of the Running ES Score & Positions of GeneSet Members on the Rank Ordered List
| Dataset | CMP.CMP_Pheno.cls#Group3_versus_Group4.CMP_Pheno.cls#Group3_versus_Group4_repos |
| Phenotype | CMP_Pheno.cls#Group3_versus_Group4_repos |
| Upregulated in class | 3 |
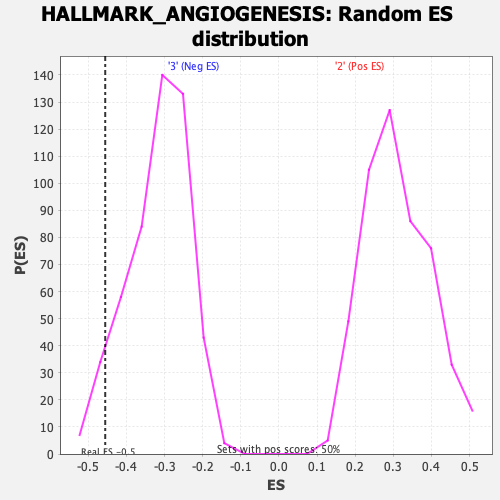
| GeneSet | HALLMARK_ANGIOGENESIS |
| Enrichment Score (ES) | -0.45545456 |
| Normalized Enrichment Score (NES) | -1.4409144 |
| Nominal p-value | 0.041749503 |
| FDR q-value | 0.35711902 |
| FWER p-Value | 0.499 |
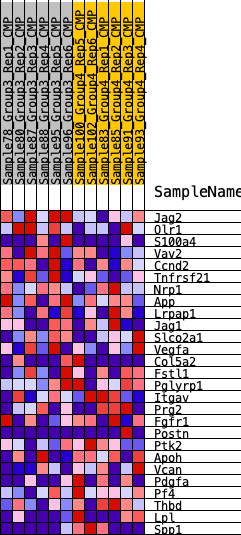
| SYMBOL | RANK IN GENE LIST | RANK METRIC SCORE | RUNNING ES | CORE ENRICHMENT | |
|---|---|---|---|---|---|
| 1 | Jag2 | 813 | 0.521 | 0.0347 | No |
| 2 | Olr1 | 1768 | 0.390 | 0.0432 | No |
| 3 | S100a4 | 2213 | 0.350 | 0.0717 | No |
| 4 | Vav2 | 3563 | 0.250 | 0.0398 | No |
| 5 | Ccnd2 | 5566 | 0.152 | -0.0395 | No |
| 6 | Tnfrsf21 | 6074 | 0.134 | -0.0456 | No |
| 7 | Nrp1 | 6178 | 0.131 | -0.0317 | No |
| 8 | App | 6993 | 0.100 | -0.0584 | No |
| 9 | Lrpap1 | 7523 | 0.081 | -0.0734 | No |
| 10 | Jag1 | 8210 | 0.058 | -0.0997 | No |
| 11 | Slco2a1 | 8364 | 0.053 | -0.0998 | No |
| 12 | Vegfa | 9466 | 0.016 | -0.1532 | No |
| 13 | Col5a2 | 9535 | 0.014 | -0.1547 | No |
| 14 | Fstl1 | 10945 | -0.027 | -0.2222 | No |
| 15 | Pglyrp1 | 12899 | -0.087 | -0.3084 | No |
| 16 | Itgav | 13107 | -0.095 | -0.3051 | No |
| 17 | Prg2 | 15036 | -0.172 | -0.3776 | No |
| 18 | Fgfr1 | 15579 | -0.191 | -0.3772 | No |
| 19 | Postn | 17126 | -0.280 | -0.4146 | Yes |
| 20 | Ptk2 | 17348 | -0.297 | -0.3825 | Yes |
| 21 | Apoh | 18238 | -0.372 | -0.3733 | Yes |
| 22 | Vcan | 18800 | -0.439 | -0.3378 | Yes |
| 23 | Pdgfa | 18931 | -0.459 | -0.2775 | Yes |
| 24 | Pf4 | 18983 | -0.471 | -0.2114 | Yes |
| 25 | Thbd | 18987 | -0.472 | -0.1428 | Yes |
| 26 | Lpl | 19451 | -0.594 | -0.0796 | Yes |
| 27 | Spp1 | 19568 | -0.657 | 0.0103 | Yes |