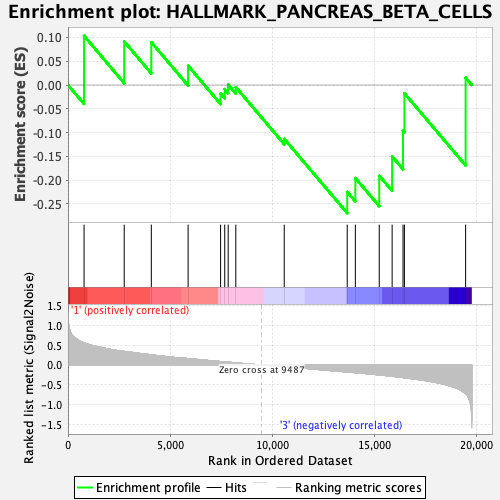
Profile of the Running ES Score & Positions of GeneSet Members on the Rank Ordered List
| Dataset | CMP.CMP_Pheno.cls#Group2_versus_Group4.CMP_Pheno.cls#Group2_versus_Group4_repos |
| Phenotype | CMP_Pheno.cls#Group2_versus_Group4_repos |
| Upregulated in class | 3 |
| GeneSet | HALLMARK_PANCREAS_BETA_CELLS |
| Enrichment Score (ES) | -0.2693576 |
| Normalized Enrichment Score (NES) | -0.75579816 |
| Nominal p-value | 0.81060606 |
| FDR q-value | 0.90869486 |
| FWER p-Value | 1.0 |
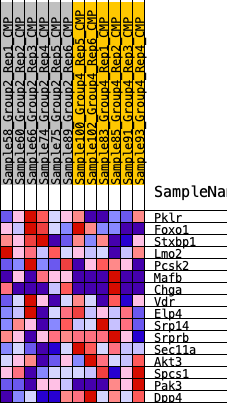
| SYMBOL | RANK IN GENE LIST | RANK METRIC SCORE | RUNNING ES | CORE ENRICHMENT | |
|---|---|---|---|---|---|
| 1 | Pklr | 786 | 0.557 | 0.1033 | No |
| 2 | Foxo1 | 2752 | 0.341 | 0.0915 | No |
| 3 | Stxbp1 | 4079 | 0.255 | 0.0900 | No |
| 4 | Lmo2 | 5881 | 0.162 | 0.0405 | No |
| 5 | Pcsk2 | 7471 | 0.086 | -0.0179 | No |
| 6 | Mafb | 7674 | 0.076 | -0.0085 | No |
| 7 | Chga | 7843 | 0.070 | 0.0009 | No |
| 8 | Vdr | 8216 | 0.052 | -0.0045 | No |
| 9 | Elp4 | 10587 | -0.044 | -0.1133 | No |
| 10 | Srp14 | 13671 | -0.174 | -0.2247 | Yes |
| 11 | Srprb | 14069 | -0.192 | -0.1956 | Yes |
| 12 | Sec11a | 15239 | -0.249 | -0.1907 | Yes |
| 13 | Akt3 | 15870 | -0.282 | -0.1501 | Yes |
| 14 | Spcs1 | 16403 | -0.315 | -0.0961 | Yes |
| 15 | Pak3 | 16471 | -0.319 | -0.0174 | Yes |
| 16 | Dpp4 | 19468 | -0.717 | 0.0153 | Yes |