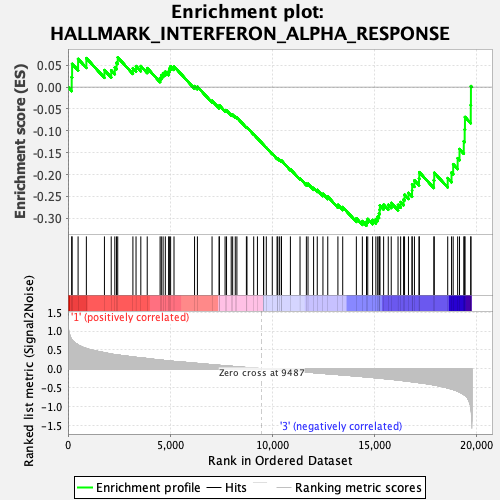
Profile of the Running ES Score & Positions of GeneSet Members on the Rank Ordered List
| Dataset | CMP.CMP_Pheno.cls#Group2_versus_Group4.CMP_Pheno.cls#Group2_versus_Group4_repos |
| Phenotype | CMP_Pheno.cls#Group2_versus_Group4_repos |
| Upregulated in class | 3 |
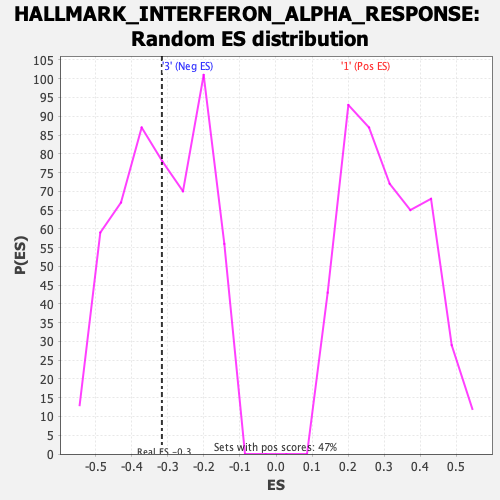
| GeneSet | HALLMARK_INTERFERON_ALPHA_RESPONSE |
| Enrichment Score (ES) | -0.31685328 |
| Normalized Enrichment Score (NES) | -0.9996133 |
| Nominal p-value | 0.5065913 |
| FDR q-value | 1.0 |
| FWER p-Value | 0.987 |
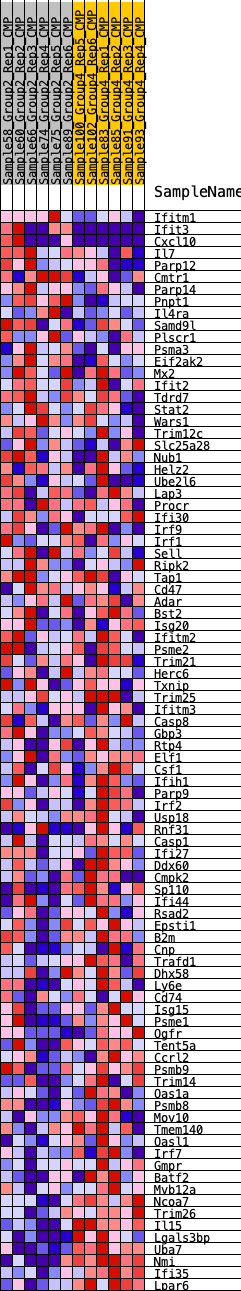
| SYMBOL | RANK IN GENE LIST | RANK METRIC SCORE | RUNNING ES | CORE ENRICHMENT | |
|---|---|---|---|---|---|
| 1 | Ifitm1 | 181 | 0.768 | 0.0227 | No |
| 2 | Ifit3 | 201 | 0.753 | 0.0531 | No |
| 3 | Cxcl10 | 494 | 0.630 | 0.0644 | No |
| 4 | Il7 | 899 | 0.537 | 0.0662 | No |
| 5 | Parp12 | 1784 | 0.424 | 0.0389 | No |
| 6 | Cmtr1 | 2116 | 0.389 | 0.0382 | No |
| 7 | Parp14 | 2292 | 0.373 | 0.0448 | No |
| 8 | Pnpt1 | 2376 | 0.365 | 0.0558 | No |
| 9 | Il4ra | 2435 | 0.361 | 0.0679 | No |
| 10 | Samd9l | 3178 | 0.313 | 0.0432 | No |
| 11 | Plscr1 | 3331 | 0.300 | 0.0480 | No |
| 12 | Psma3 | 3565 | 0.287 | 0.0481 | No |
| 13 | Eif2ak2 | 3879 | 0.269 | 0.0433 | No |
| 14 | Mx2 | 4509 | 0.228 | 0.0209 | No |
| 15 | Ifit2 | 4569 | 0.225 | 0.0272 | No |
| 16 | Tdrd7 | 4656 | 0.221 | 0.0320 | No |
| 17 | Stat2 | 4765 | 0.214 | 0.0354 | No |
| 18 | Wars1 | 4927 | 0.205 | 0.0358 | No |
| 19 | Trim12c | 4963 | 0.203 | 0.0425 | No |
| 20 | Slc25a28 | 5024 | 0.200 | 0.0477 | No |
| 21 | Nub1 | 5190 | 0.192 | 0.0473 | No |
| 22 | Helz2 | 6196 | 0.144 | 0.0022 | No |
| 23 | Ube2l6 | 6336 | 0.139 | 0.0009 | No |
| 24 | Lap3 | 7053 | 0.105 | -0.0311 | No |
| 25 | Procr | 7398 | 0.089 | -0.0449 | No |
| 26 | Ifi30 | 7411 | 0.088 | -0.0418 | No |
| 27 | Irf9 | 7691 | 0.076 | -0.0529 | No |
| 28 | Irf1 | 7762 | 0.073 | -0.0534 | No |
| 29 | Sell | 7991 | 0.064 | -0.0623 | No |
| 30 | Ripk2 | 8062 | 0.060 | -0.0634 | No |
| 31 | Tap1 | 8190 | 0.053 | -0.0676 | No |
| 32 | Cd47 | 8269 | 0.050 | -0.0695 | No |
| 33 | Adar | 8734 | 0.030 | -0.0918 | No |
| 34 | Bst2 | 8762 | 0.029 | -0.0920 | No |
| 35 | Isg20 | 9092 | 0.016 | -0.1080 | No |
| 36 | Ifitm2 | 9275 | 0.008 | -0.1169 | No |
| 37 | Psme2 | 9575 | -0.001 | -0.1321 | No |
| 38 | Trim21 | 9580 | -0.001 | -0.1323 | No |
| 39 | Herc6 | 9709 | -0.007 | -0.1385 | No |
| 40 | Txnip | 10002 | -0.019 | -0.1525 | No |
| 41 | Trim25 | 10236 | -0.028 | -0.1632 | No |
| 42 | Ifitm3 | 10269 | -0.030 | -0.1635 | No |
| 43 | Casp8 | 10349 | -0.034 | -0.1662 | No |
| 44 | Gbp3 | 10442 | -0.038 | -0.1693 | No |
| 45 | Rtp4 | 10453 | -0.038 | -0.1682 | No |
| 46 | Elf1 | 10889 | -0.056 | -0.1880 | No |
| 47 | Csf1 | 11360 | -0.074 | -0.2088 | No |
| 48 | Ifih1 | 11671 | -0.087 | -0.2209 | No |
| 49 | Parp9 | 11751 | -0.090 | -0.2212 | No |
| 50 | Irf2 | 12024 | -0.103 | -0.2307 | No |
| 51 | Usp18 | 12204 | -0.111 | -0.2352 | No |
| 52 | Rnf31 | 12482 | -0.123 | -0.2442 | No |
| 53 | Casp1 | 12718 | -0.133 | -0.2506 | No |
| 54 | Ifi27 | 13215 | -0.154 | -0.2694 | No |
| 55 | Ddx60 | 13450 | -0.165 | -0.2745 | No |
| 56 | Cmpk2 | 14118 | -0.194 | -0.3003 | No |
| 57 | Sp110 | 14412 | -0.207 | -0.3066 | No |
| 58 | Ifi44 | 14615 | -0.217 | -0.3078 | Yes |
| 59 | Rsad2 | 14676 | -0.221 | -0.3017 | Yes |
| 60 | Epsti1 | 14912 | -0.232 | -0.3040 | Yes |
| 61 | B2m | 15073 | -0.240 | -0.3021 | Yes |
| 62 | Cnp | 15163 | -0.245 | -0.2965 | Yes |
| 63 | Trafd1 | 15226 | -0.249 | -0.2893 | Yes |
| 64 | Dhx58 | 15261 | -0.250 | -0.2806 | Yes |
| 65 | Ly6e | 15270 | -0.250 | -0.2707 | Yes |
| 66 | Cd74 | 15453 | -0.260 | -0.2691 | Yes |
| 67 | Isg15 | 15680 | -0.272 | -0.2693 | Yes |
| 68 | Psme1 | 15826 | -0.280 | -0.2650 | Yes |
| 69 | Ogfr | 16159 | -0.299 | -0.2695 | Yes |
| 70 | Tent5a | 16286 | -0.308 | -0.2631 | Yes |
| 71 | Ccrl2 | 16430 | -0.318 | -0.2572 | Yes |
| 72 | Psmb9 | 16478 | -0.320 | -0.2463 | Yes |
| 73 | Trim14 | 16669 | -0.332 | -0.2421 | Yes |
| 74 | Oas1a | 16845 | -0.345 | -0.2367 | Yes |
| 75 | Psmb8 | 16850 | -0.346 | -0.2225 | Yes |
| 76 | Mov10 | 16962 | -0.354 | -0.2135 | Yes |
| 77 | Tmem140 | 17186 | -0.369 | -0.2095 | Yes |
| 78 | Oasl1 | 17201 | -0.370 | -0.1948 | Yes |
| 79 | Irf7 | 17912 | -0.430 | -0.2130 | Yes |
| 80 | Gmpr | 17932 | -0.431 | -0.1960 | Yes |
| 81 | Batf2 | 18591 | -0.511 | -0.2082 | Yes |
| 82 | Mvb12a | 18778 | -0.537 | -0.1953 | Yes |
| 83 | Ncoa7 | 18859 | -0.552 | -0.1765 | Yes |
| 84 | Trim26 | 19078 | -0.596 | -0.1628 | Yes |
| 85 | Il15 | 19169 | -0.616 | -0.1418 | Yes |
| 86 | Lgals3bp | 19378 | -0.683 | -0.1239 | Yes |
| 87 | Uba7 | 19422 | -0.700 | -0.0971 | Yes |
| 88 | Nmi | 19436 | -0.705 | -0.0684 | Yes |
| 89 | Ifi35 | 19720 | -1.002 | -0.0412 | Yes |
| 90 | Lpar6 | 19728 | -1.052 | 0.0022 | Yes |