Profile of the Running ES Score & Positions of GeneSet Members on the Rank Ordered List
| Dataset | CMP.CMP_Pheno.cls#Group2_versus_Group4.CMP_Pheno.cls#Group2_versus_Group4_repos |
| Phenotype | CMP_Pheno.cls#Group2_versus_Group4_repos |
| Upregulated in class | 1 |
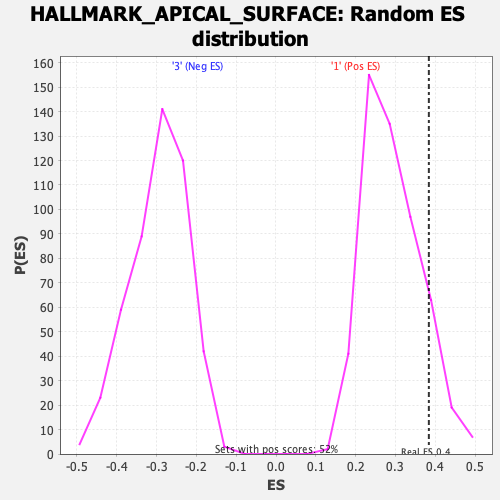
| GeneSet | HALLMARK_APICAL_SURFACE |
| Enrichment Score (ES) | 0.38381037 |
| Normalized Enrichment Score (NES) | 1.3128029 |
| Nominal p-value | 0.1310212 |
| FDR q-value | 0.33743027 |
| FWER p-Value | 0.704 |
| SYMBOL | RANK IN GENE LIST | RANK METRIC SCORE | RUNNING ES | CORE ENRICHMENT | |
|---|---|---|---|---|---|
| 1 | App | 824 | 0.548 | 0.0155 | Yes |
| 2 | Brca1 | 1225 | 0.486 | 0.0461 | Yes |
| 3 | Il2rg | 1301 | 0.476 | 0.0920 | Yes |
| 4 | Rhcg | 1450 | 0.460 | 0.1326 | Yes |
| 5 | Shroom2 | 1474 | 0.458 | 0.1793 | Yes |
| 6 | Sulf2 | 1603 | 0.444 | 0.2193 | Yes |
| 7 | Adam10 | 1656 | 0.438 | 0.2625 | Yes |
| 8 | Atp6v0a4 | 1879 | 0.412 | 0.2943 | Yes |
| 9 | Plaur | 1996 | 0.401 | 0.3304 | Yes |
| 10 | Crocc | 2339 | 0.369 | 0.3517 | Yes |
| 11 | Pkhd1 | 2618 | 0.350 | 0.3742 | Yes |
| 12 | Thy1 | 3087 | 0.319 | 0.3838 | Yes |
| 13 | Tmem8b | 4367 | 0.237 | 0.3438 | No |
| 14 | Ghrl | 4817 | 0.211 | 0.3430 | No |
| 15 | Gata3 | 6113 | 0.149 | 0.2930 | No |
| 16 | Gstm5 | 7094 | 0.103 | 0.2541 | No |
| 17 | Flot2 | 7388 | 0.089 | 0.2485 | No |
| 18 | Rtn4rl1 | 10371 | -0.035 | 0.1011 | No |
| 19 | Akap7 | 10671 | -0.047 | 0.0908 | No |
| 20 | Ntng1 | 10803 | -0.052 | 0.0896 | No |
| 21 | Adipor2 | 10841 | -0.054 | 0.0933 | No |
| 22 | Ephb4 | 12464 | -0.122 | 0.0239 | No |
| 23 | Lyn | 12686 | -0.132 | 0.0265 | No |
| 24 | B4galt1 | 13023 | -0.146 | 0.0248 | No |
| 25 | Mdga1 | 13987 | -0.188 | -0.0044 | No |
| 26 | Ncoa6 | 14334 | -0.204 | -0.0006 | No |
| 27 | Cd160 | 14935 | -0.233 | -0.0066 | No |
| 28 | Scube1 | 15106 | -0.242 | 0.0101 | No |
| 29 | Pcsk9 | 15509 | -0.263 | 0.0172 | No |
| 30 | Efna5 | 16416 | -0.316 | 0.0044 | No |
| 31 | Cx3cl1 | 16970 | -0.354 | 0.0134 | No |
| 32 | Atp8b1 | 17417 | -0.385 | 0.0311 | No |
| 33 | Dcbld2 | 17419 | -0.386 | 0.0714 | No |
| 34 | Crybg1 | 18187 | -0.457 | 0.0803 | No |