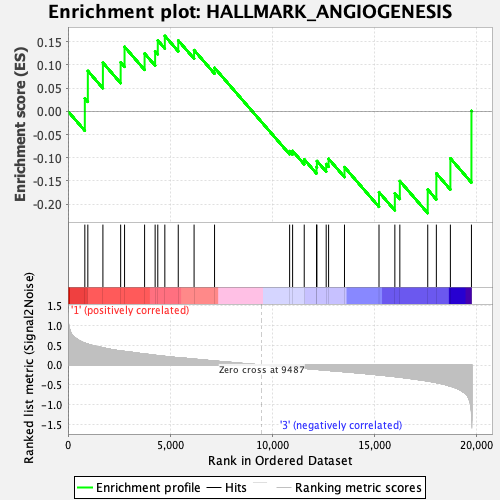
Profile of the Running ES Score & Positions of GeneSet Members on the Rank Ordered List
| Dataset | CMP.CMP_Pheno.cls#Group2_versus_Group4.CMP_Pheno.cls#Group2_versus_Group4_repos |
| Phenotype | CMP_Pheno.cls#Group2_versus_Group4_repos |
| Upregulated in class | 3 |
| GeneSet | HALLMARK_ANGIOGENESIS |
| Enrichment Score (ES) | -0.21917608 |
| Normalized Enrichment Score (NES) | -0.7063175 |
| Nominal p-value | 0.9411765 |
| FDR q-value | 0.922684 |
| FWER p-Value | 1.0 |
| SYMBOL | RANK IN GENE LIST | RANK METRIC SCORE | RUNNING ES | CORE ENRICHMENT | |
|---|---|---|---|---|---|
| 1 | App | 824 | 0.548 | 0.0278 | No |
| 2 | S100a4 | 971 | 0.524 | 0.0870 | No |
| 3 | Olr1 | 1709 | 0.433 | 0.1046 | No |
| 4 | Slco2a1 | 2578 | 0.352 | 0.1054 | No |
| 5 | Jag1 | 2769 | 0.340 | 0.1389 | No |
| 6 | Fstl1 | 3750 | 0.277 | 0.1244 | No |
| 7 | Jag2 | 4266 | 0.242 | 0.1291 | No |
| 8 | Vegfa | 4396 | 0.235 | 0.1525 | No |
| 9 | Lrpap1 | 4741 | 0.215 | 0.1624 | No |
| 10 | Ptk2 | 5398 | 0.184 | 0.1525 | No |
| 11 | Pglyrp1 | 6173 | 0.145 | 0.1318 | No |
| 12 | Vav2 | 7175 | 0.099 | 0.0936 | No |
| 13 | Postn | 10851 | -0.054 | -0.0856 | No |
| 14 | Prg2 | 10997 | -0.061 | -0.0853 | No |
| 15 | Col5a2 | 11566 | -0.083 | -0.1034 | No |
| 16 | Thbd | 12167 | -0.109 | -0.1200 | No |
| 17 | Apoh | 12187 | -0.110 | -0.1070 | No |
| 18 | Tnfrsf21 | 12641 | -0.129 | -0.1135 | No |
| 19 | Nrp1 | 12759 | -0.135 | -0.1023 | No |
| 20 | Ccnd2 | 13537 | -0.169 | -0.1201 | No |
| 21 | Fgfr1 | 15227 | -0.249 | -0.1741 | No |
| 22 | Pdgfa | 16003 | -0.290 | -0.1765 | Yes |
| 23 | Itgav | 16247 | -0.305 | -0.1500 | Yes |
| 24 | Vcan | 17613 | -0.400 | -0.1685 | Yes |
| 25 | Lpl | 18035 | -0.442 | -0.1337 | Yes |
| 26 | Spp1 | 18722 | -0.529 | -0.1012 | Yes |
| 27 | Pf4 | 19753 | -1.215 | 0.0009 | Yes |

