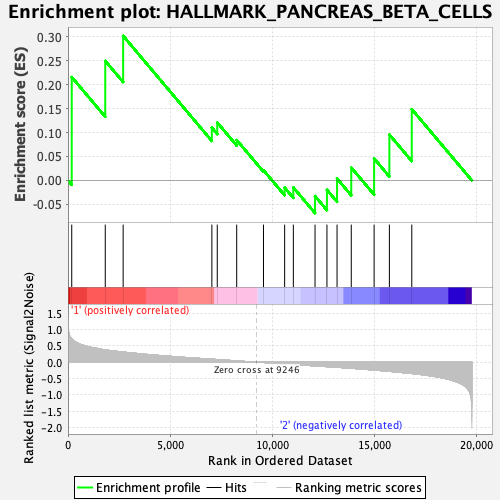
Profile of the Running ES Score & Positions of GeneSet Members on the Rank Ordered List
| Dataset | CMP.CMP_Pheno.cls#Group2_versus_Group3.CMP_Pheno.cls#Group2_versus_Group3_repos |
| Phenotype | CMP_Pheno.cls#Group2_versus_Group3_repos |
| Upregulated in class | 1 |
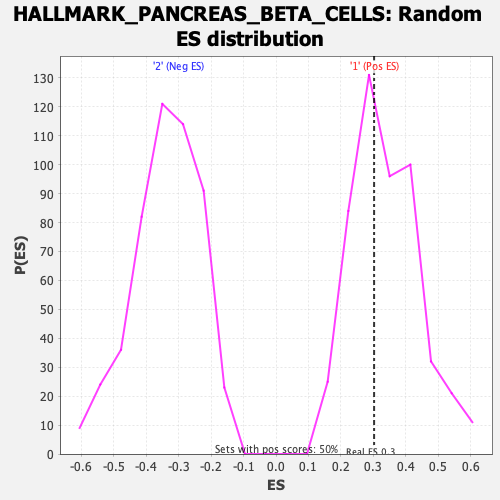
| GeneSet | HALLMARK_PANCREAS_BETA_CELLS |
| Enrichment Score (ES) | 0.3021177 |
| Normalized Enrichment Score (NES) | 0.89457357 |
| Nominal p-value | 0.574 |
| FDR q-value | 0.7947247 |
| FWER p-Value | 1.0 |
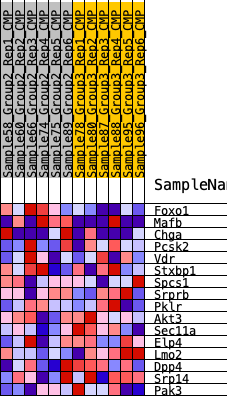
| SYMBOL | RANK IN GENE LIST | RANK METRIC SCORE | RUNNING ES | CORE ENRICHMENT | |
|---|---|---|---|---|---|
| 1 | Foxo1 | 183 | 0.718 | 0.2160 | Yes |
| 2 | Mafb | 1824 | 0.373 | 0.2498 | Yes |
| 3 | Chga | 2700 | 0.308 | 0.3021 | Yes |
| 4 | Pcsk2 | 7044 | 0.089 | 0.1101 | No |
| 5 | Vdr | 7308 | 0.077 | 0.1209 | No |
| 6 | Stxbp1 | 8260 | 0.037 | 0.0843 | No |
| 7 | Spcs1 | 9571 | -0.010 | 0.0212 | No |
| 8 | Srprb | 10607 | -0.051 | -0.0152 | No |
| 9 | Pklr | 11033 | -0.070 | -0.0149 | No |
| 10 | Akt3 | 12095 | -0.114 | -0.0329 | No |
| 11 | Sec11a | 12678 | -0.136 | -0.0199 | No |
| 12 | Elp4 | 13173 | -0.155 | 0.0038 | No |
| 13 | Lmo2 | 13869 | -0.185 | 0.0267 | No |
| 14 | Dpp4 | 14988 | -0.241 | 0.0457 | No |
| 15 | Srp14 | 15735 | -0.280 | 0.0957 | No |
| 16 | Pak3 | 16832 | -0.346 | 0.1488 | No |