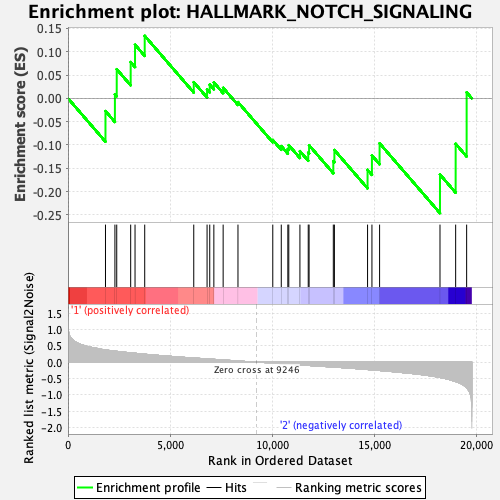
Profile of the Running ES Score & Positions of GeneSet Members on the Rank Ordered List
| Dataset | CMP.CMP_Pheno.cls#Group2_versus_Group3.CMP_Pheno.cls#Group2_versus_Group3_repos |
| Phenotype | CMP_Pheno.cls#Group2_versus_Group3_repos |
| Upregulated in class | 2 |
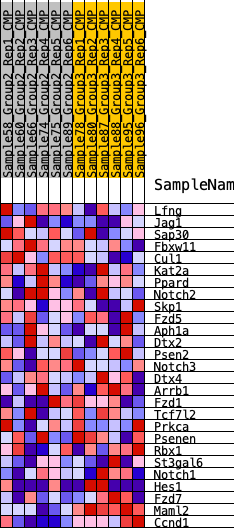
| GeneSet | HALLMARK_NOTCH_SIGNALING |
| Enrichment Score (ES) | -0.2461452 |
| Normalized Enrichment Score (NES) | -0.8270074 |
| Nominal p-value | 0.74404764 |
| FDR q-value | 1.0 |
| FWER p-Value | 1.0 |
| SYMBOL | RANK IN GENE LIST | RANK METRIC SCORE | RUNNING ES | CORE ENRICHMENT | |
|---|---|---|---|---|---|
| 1 | Lfng | 1835 | 0.372 | -0.0273 | No |
| 2 | Jag1 | 2297 | 0.337 | 0.0087 | No |
| 3 | Sap30 | 2386 | 0.330 | 0.0624 | No |
| 4 | Fbxw11 | 3069 | 0.283 | 0.0778 | No |
| 5 | Cul1 | 3282 | 0.271 | 0.1149 | No |
| 6 | Kat2a | 3756 | 0.244 | 0.1339 | No |
| 7 | Ppard | 6157 | 0.126 | 0.0346 | No |
| 8 | Notch2 | 6809 | 0.100 | 0.0193 | No |
| 9 | Skp1 | 6940 | 0.094 | 0.0293 | No |
| 10 | Fzd5 | 7141 | 0.084 | 0.0341 | No |
| 11 | Aph1a | 7596 | 0.065 | 0.0225 | No |
| 12 | Dtx2 | 8322 | 0.034 | -0.0081 | No |
| 13 | Psen2 | 10026 | -0.029 | -0.0893 | No |
| 14 | Notch3 | 10442 | -0.044 | -0.1025 | No |
| 15 | Dtx4 | 10764 | -0.058 | -0.1086 | No |
| 16 | Arrb1 | 10810 | -0.059 | -0.1004 | No |
| 17 | Fzd1 | 11355 | -0.083 | -0.1133 | No |
| 18 | Tcf7l2 | 11762 | -0.099 | -0.1163 | No |
| 19 | Prkca | 11804 | -0.101 | -0.1006 | No |
| 20 | Psenen | 12990 | -0.148 | -0.1346 | No |
| 21 | Rbx1 | 13043 | -0.150 | -0.1108 | No |
| 22 | St3gal6 | 14667 | -0.225 | -0.1534 | No |
| 23 | Notch1 | 14881 | -0.236 | -0.1225 | No |
| 24 | Hes1 | 15256 | -0.255 | -0.0964 | No |
| 25 | Fzd7 | 18213 | -0.469 | -0.1634 | Yes |
| 26 | Maml2 | 18980 | -0.593 | -0.0975 | Yes |
| 27 | Ccnd1 | 19518 | -0.779 | 0.0128 | Yes |