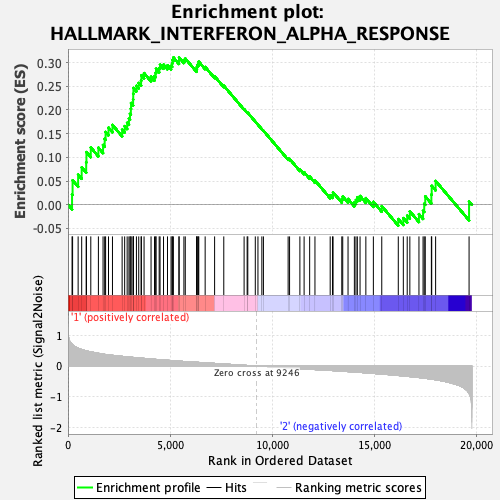
Profile of the Running ES Score & Positions of GeneSet Members on the Rank Ordered List
| Dataset | CMP.CMP_Pheno.cls#Group2_versus_Group3.CMP_Pheno.cls#Group2_versus_Group3_repos |
| Phenotype | CMP_Pheno.cls#Group2_versus_Group3_repos |
| Upregulated in class | 1 |
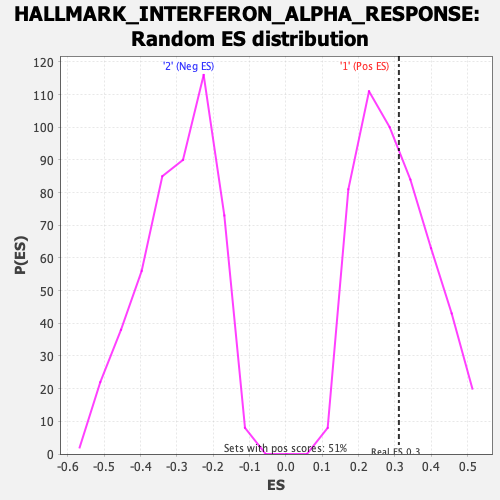
| GeneSet | HALLMARK_INTERFERON_ALPHA_RESPONSE |
| Enrichment Score (ES) | 0.3110543 |
| Normalized Enrichment Score (NES) | 1.0496669 |
| Nominal p-value | 0.42352942 |
| FDR q-value | 0.70604134 |
| FWER p-Value | 0.986 |
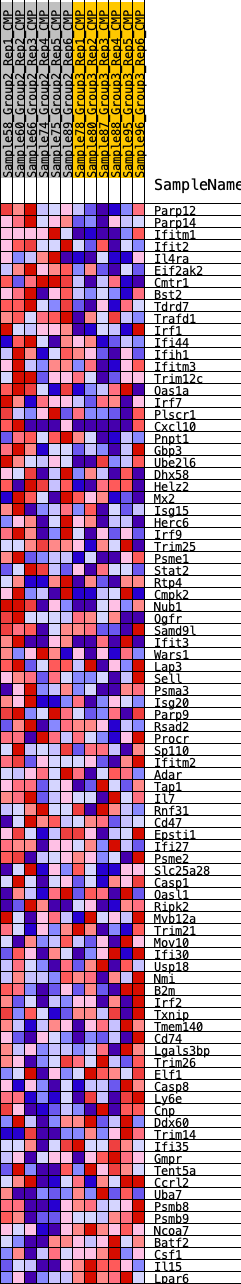
| SYMBOL | RANK IN GENE LIST | RANK METRIC SCORE | RUNNING ES | CORE ENRICHMENT | |
|---|---|---|---|---|---|
| 1 | Parp12 | 199 | 0.706 | 0.0217 | Yes |
| 2 | Parp14 | 225 | 0.688 | 0.0514 | Yes |
| 3 | Ifitm1 | 496 | 0.574 | 0.0635 | Yes |
| 4 | Ifit2 | 670 | 0.532 | 0.0787 | Yes |
| 5 | Il4ra | 891 | 0.490 | 0.0896 | Yes |
| 6 | Eif2ak2 | 903 | 0.487 | 0.1110 | Yes |
| 7 | Cmtr1 | 1116 | 0.455 | 0.1208 | Yes |
| 8 | Bst2 | 1488 | 0.411 | 0.1204 | Yes |
| 9 | Tdrd7 | 1716 | 0.383 | 0.1262 | Yes |
| 10 | Trafd1 | 1796 | 0.376 | 0.1391 | Yes |
| 11 | Irf1 | 1841 | 0.371 | 0.1536 | Yes |
| 12 | Ifi44 | 1983 | 0.361 | 0.1627 | Yes |
| 13 | Ifih1 | 2177 | 0.345 | 0.1684 | Yes |
| 14 | Ifitm3 | 2650 | 0.312 | 0.1585 | Yes |
| 15 | Trim12c | 2774 | 0.302 | 0.1659 | Yes |
| 16 | Oas1a | 2896 | 0.295 | 0.1730 | Yes |
| 17 | Irf7 | 2984 | 0.289 | 0.1816 | Yes |
| 18 | Plscr1 | 3035 | 0.285 | 0.1919 | Yes |
| 19 | Cxcl10 | 3077 | 0.282 | 0.2026 | Yes |
| 20 | Pnpt1 | 3088 | 0.282 | 0.2148 | Yes |
| 21 | Gbp3 | 3188 | 0.277 | 0.2222 | Yes |
| 22 | Ube2l6 | 3194 | 0.277 | 0.2344 | Yes |
| 23 | Dhx58 | 3203 | 0.276 | 0.2465 | Yes |
| 24 | Helz2 | 3350 | 0.267 | 0.2511 | Yes |
| 25 | Mx2 | 3463 | 0.260 | 0.2571 | Yes |
| 26 | Isg15 | 3579 | 0.253 | 0.2627 | Yes |
| 27 | Herc6 | 3594 | 0.252 | 0.2733 | Yes |
| 28 | Irf9 | 3724 | 0.245 | 0.2778 | Yes |
| 29 | Trim25 | 4066 | 0.224 | 0.2706 | Yes |
| 30 | Psme1 | 4236 | 0.217 | 0.2718 | Yes |
| 31 | Stat2 | 4293 | 0.214 | 0.2786 | Yes |
| 32 | Rtp4 | 4311 | 0.213 | 0.2873 | Yes |
| 33 | Cmpk2 | 4464 | 0.203 | 0.2887 | Yes |
| 34 | Nub1 | 4507 | 0.201 | 0.2957 | Yes |
| 35 | Ogfr | 4677 | 0.193 | 0.2958 | Yes |
| 36 | Samd9l | 4871 | 0.185 | 0.2943 | Yes |
| 37 | Ifit3 | 5045 | 0.176 | 0.2934 | Yes |
| 38 | Wars1 | 5098 | 0.173 | 0.2986 | Yes |
| 39 | Lap3 | 5112 | 0.172 | 0.3057 | Yes |
| 40 | Sell | 5160 | 0.170 | 0.3110 | Yes |
| 41 | Psma3 | 5433 | 0.157 | 0.3042 | Yes |
| 42 | Isg20 | 5439 | 0.157 | 0.3111 | Yes |
| 43 | Parp9 | 5675 | 0.145 | 0.3056 | No |
| 44 | Rsad2 | 5742 | 0.143 | 0.3087 | No |
| 45 | Procr | 6295 | 0.120 | 0.2861 | No |
| 46 | Sp110 | 6310 | 0.120 | 0.2908 | No |
| 47 | Ifitm2 | 6329 | 0.119 | 0.2952 | No |
| 48 | Adar | 6381 | 0.117 | 0.2979 | No |
| 49 | Tap1 | 6403 | 0.115 | 0.3020 | No |
| 50 | Il7 | 6715 | 0.103 | 0.2908 | No |
| 51 | Rnf31 | 7178 | 0.083 | 0.2711 | No |
| 52 | Cd47 | 7627 | 0.064 | 0.2512 | No |
| 53 | Epsti1 | 8622 | 0.022 | 0.2017 | No |
| 54 | Ifi27 | 8771 | 0.016 | 0.1949 | No |
| 55 | Psme2 | 8803 | 0.015 | 0.1940 | No |
| 56 | Slc25a28 | 9170 | 0.002 | 0.1755 | No |
| 57 | Casp1 | 9300 | -0.000 | 0.1690 | No |
| 58 | Oasl1 | 9491 | -0.007 | 0.1596 | No |
| 59 | Ripk2 | 9568 | -0.010 | 0.1562 | No |
| 60 | Mvb12a | 10778 | -0.058 | 0.0974 | No |
| 61 | Trim21 | 10848 | -0.061 | 0.0967 | No |
| 62 | Mov10 | 11353 | -0.083 | 0.0748 | No |
| 63 | Ifi30 | 11560 | -0.092 | 0.0685 | No |
| 64 | Usp18 | 11832 | -0.103 | 0.0594 | No |
| 65 | Nmi | 12091 | -0.114 | 0.0514 | No |
| 66 | B2m | 12837 | -0.141 | 0.0199 | No |
| 67 | Irf2 | 12950 | -0.146 | 0.0208 | No |
| 68 | Txnip | 12978 | -0.147 | 0.0260 | No |
| 69 | Tmem140 | 13405 | -0.166 | 0.0119 | No |
| 70 | Cd74 | 13451 | -0.168 | 0.0172 | No |
| 71 | Lgals3bp | 13711 | -0.179 | 0.0121 | No |
| 72 | Trim26 | 14021 | -0.192 | 0.0050 | No |
| 73 | Elf1 | 14099 | -0.197 | 0.0100 | No |
| 74 | Casp8 | 14167 | -0.201 | 0.0157 | No |
| 75 | Ly6e | 14299 | -0.207 | 0.0183 | No |
| 76 | Cnp | 14583 | -0.220 | 0.0139 | No |
| 77 | Ddx60 | 14951 | -0.239 | 0.0060 | No |
| 78 | Trim14 | 15362 | -0.261 | -0.0031 | No |
| 79 | Ifi35 | 16171 | -0.306 | -0.0304 | No |
| 80 | Gmpr | 16418 | -0.321 | -0.0284 | No |
| 81 | Tent5a | 16608 | -0.333 | -0.0230 | No |
| 82 | Ccrl2 | 16737 | -0.341 | -0.0141 | No |
| 83 | Uba7 | 17183 | -0.371 | -0.0200 | No |
| 84 | Psmb8 | 17384 | -0.388 | -0.0127 | No |
| 85 | Psmb9 | 17441 | -0.393 | 0.0022 | No |
| 86 | Ncoa7 | 17492 | -0.397 | 0.0176 | No |
| 87 | Batf2 | 17791 | -0.423 | 0.0215 | No |
| 88 | Csf1 | 17808 | -0.424 | 0.0398 | No |
| 89 | Il15 | 17999 | -0.443 | 0.0501 | No |
| 90 | Lpar6 | 19637 | -0.885 | 0.0068 | No |