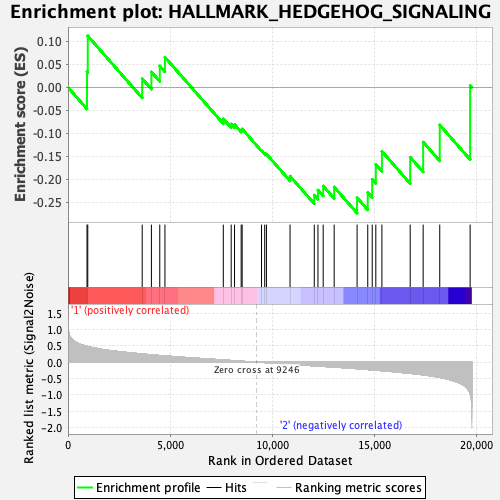
Profile of the Running ES Score & Positions of GeneSet Members on the Rank Ordered List
| Dataset | CMP.CMP_Pheno.cls#Group2_versus_Group3.CMP_Pheno.cls#Group2_versus_Group3_repos |
| Phenotype | CMP_Pheno.cls#Group2_versus_Group3_repos |
| Upregulated in class | 2 |
| GeneSet | HALLMARK_HEDGEHOG_SIGNALING |
| Enrichment Score (ES) | -0.27348882 |
| Normalized Enrichment Score (NES) | -0.7895139 |
| Nominal p-value | 0.69 |
| FDR q-value | 0.95245105 |
| FWER p-Value | 1.0 |
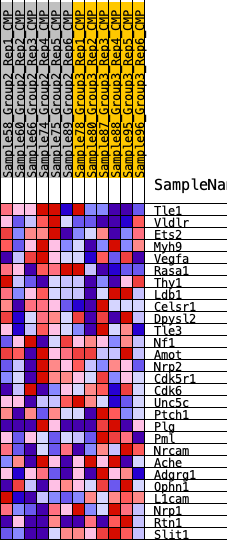
| SYMBOL | RANK IN GENE LIST | RANK METRIC SCORE | RUNNING ES | CORE ENRICHMENT | |
|---|---|---|---|---|---|
| 1 | Tle1 | 930 | 0.483 | 0.0338 | No |
| 2 | Vldlr | 968 | 0.477 | 0.1118 | No |
| 3 | Ets2 | 3633 | 0.250 | 0.0188 | No |
| 4 | Myh9 | 4083 | 0.223 | 0.0334 | No |
| 5 | Vegfa | 4493 | 0.202 | 0.0465 | No |
| 6 | Rasa1 | 4746 | 0.190 | 0.0655 | No |
| 7 | Thy1 | 7604 | 0.065 | -0.0684 | No |
| 8 | Ldb1 | 7990 | 0.049 | -0.0796 | No |
| 9 | Celsr1 | 8153 | 0.042 | -0.0809 | No |
| 10 | Dpysl2 | 8478 | 0.028 | -0.0925 | No |
| 11 | Tle3 | 8527 | 0.026 | -0.0905 | No |
| 12 | Nf1 | 9475 | -0.006 | -0.1375 | No |
| 13 | Amot | 9631 | -0.012 | -0.1433 | No |
| 14 | Nrp2 | 9715 | -0.015 | -0.1450 | No |
| 15 | Cdk5r1 | 10871 | -0.062 | -0.1930 | No |
| 16 | Cdk6 | 12058 | -0.112 | -0.2343 | No |
| 17 | Unc5c | 12238 | -0.120 | -0.2233 | No |
| 18 | Ptch1 | 12494 | -0.130 | -0.2145 | No |
| 19 | Plg | 13032 | -0.149 | -0.2167 | No |
| 20 | Pml | 14154 | -0.200 | -0.2400 | Yes |
| 21 | Nrcam | 14676 | -0.225 | -0.2286 | Yes |
| 22 | Ache | 14895 | -0.237 | -0.1999 | Yes |
| 23 | Adgrg1 | 15071 | -0.245 | -0.1678 | Yes |
| 24 | Ophn1 | 15369 | -0.261 | -0.1391 | Yes |
| 25 | L1cam | 16754 | -0.342 | -0.1519 | Yes |
| 26 | Nrp1 | 17389 | -0.388 | -0.1189 | Yes |
| 27 | Rtn1 | 18201 | -0.467 | -0.0818 | Yes |
| 28 | Slit1 | 19689 | -0.962 | 0.0042 | Yes |