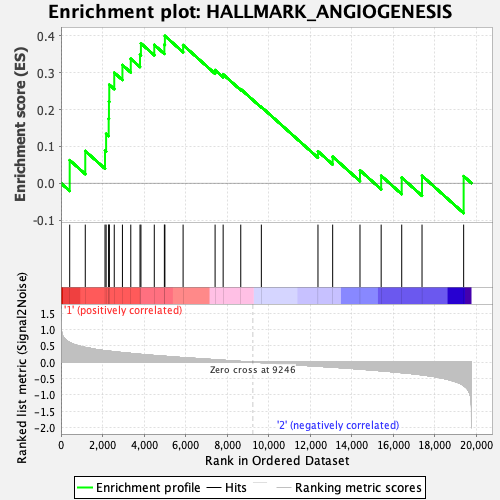
Profile of the Running ES Score & Positions of GeneSet Members on the Rank Ordered List
| Dataset | CMP.CMP_Pheno.cls#Group2_versus_Group3.CMP_Pheno.cls#Group2_versus_Group3_repos |
| Phenotype | CMP_Pheno.cls#Group2_versus_Group3_repos |
| Upregulated in class | 1 |
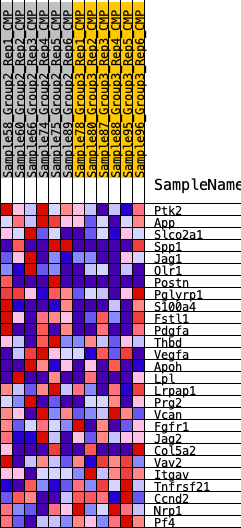
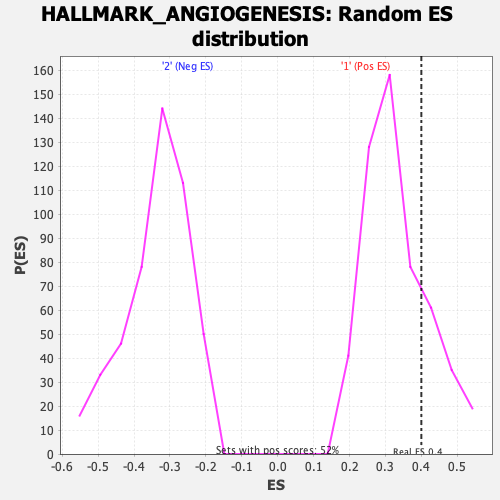
| GeneSet | HALLMARK_ANGIOGENESIS |
| Enrichment Score (ES) | 0.39992675 |
| Normalized Enrichment Score (NES) | 1.2058744 |
| Nominal p-value | 0.21346153 |
| FDR q-value | 0.5432147 |
| FWER p-Value | 0.891 |
| SYMBOL | RANK IN GENE LIST | RANK METRIC SCORE | RUNNING ES | CORE ENRICHMENT | |
|---|---|---|---|---|---|
| 1 | Ptk2 | 419 | 0.597 | 0.0625 | Yes |
| 2 | App | 1169 | 0.449 | 0.0874 | Yes |
| 3 | Slco2a1 | 2120 | 0.349 | 0.0883 | Yes |
| 4 | Spp1 | 2173 | 0.345 | 0.1341 | Yes |
| 5 | Jag1 | 2297 | 0.337 | 0.1751 | Yes |
| 6 | Olr1 | 2310 | 0.335 | 0.2214 | Yes |
| 7 | Postn | 2325 | 0.334 | 0.2675 | Yes |
| 8 | Pglyrp1 | 2565 | 0.318 | 0.3000 | Yes |
| 9 | S100a4 | 2959 | 0.290 | 0.3208 | Yes |
| 10 | Fstl1 | 3361 | 0.266 | 0.3378 | Yes |
| 11 | Pdgfa | 3806 | 0.239 | 0.3488 | Yes |
| 12 | Thbd | 3850 | 0.236 | 0.3798 | Yes |
| 13 | Vegfa | 4493 | 0.202 | 0.3755 | Yes |
| 14 | Apoh | 4979 | 0.180 | 0.3762 | Yes |
| 15 | Lpl | 5004 | 0.178 | 0.3999 | Yes |
| 16 | Lrpap1 | 5881 | 0.139 | 0.3750 | No |
| 17 | Prg2 | 7422 | 0.072 | 0.3071 | No |
| 18 | Vcan | 7810 | 0.056 | 0.2954 | No |
| 19 | Fgfr1 | 8658 | 0.021 | 0.2555 | No |
| 20 | Jag2 | 9650 | -0.013 | 0.2071 | No |
| 21 | Col5a2 | 12377 | -0.125 | 0.0866 | No |
| 22 | Vav2 | 13085 | -0.151 | 0.0720 | No |
| 23 | Itgav | 14401 | -0.211 | 0.0349 | No |
| 24 | Tnfrsf21 | 15421 | -0.264 | 0.0203 | No |
| 25 | Ccnd2 | 16411 | -0.321 | 0.0152 | No |
| 26 | Nrp1 | 17389 | -0.388 | 0.0201 | No |
| 27 | Pf4 | 19394 | -0.716 | 0.0191 | No |