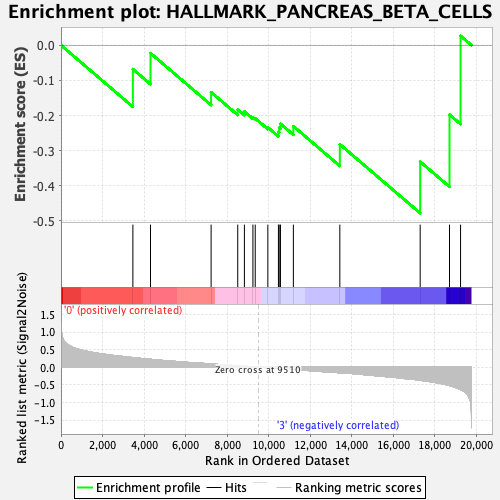
Profile of the Running ES Score & Positions of GeneSet Members on the Rank Ordered List
| Dataset | CMP.CMP_Pheno.cls#Group1_versus_Group4.CMP_Pheno.cls#Group1_versus_Group4_repos |
| Phenotype | CMP_Pheno.cls#Group1_versus_Group4_repos |
| Upregulated in class | 3 |
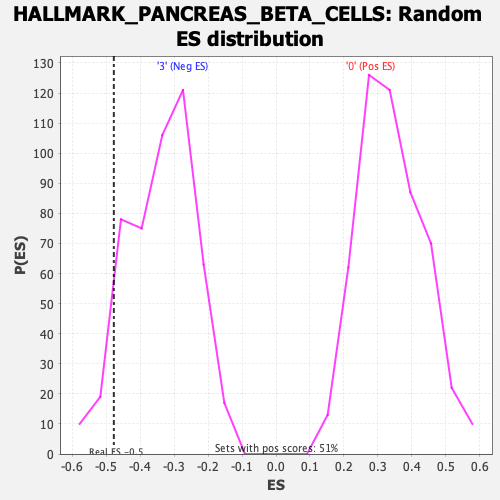
| GeneSet | HALLMARK_PANCREAS_BETA_CELLS |
| Enrichment Score (ES) | -0.47779432 |
| Normalized Enrichment Score (NES) | -1.4099563 |
| Nominal p-value | 0.0797546 |
| FDR q-value | 0.4499791 |
| FWER p-Value | 0.561 |
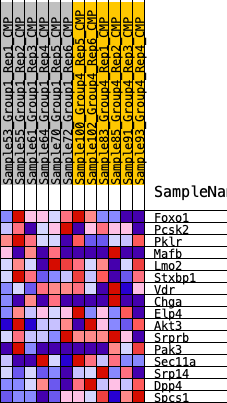
| SYMBOL | RANK IN GENE LIST | RANK METRIC SCORE | RUNNING ES | CORE ENRICHMENT | |
|---|---|---|---|---|---|
| 1 | Foxo1 | 3462 | 0.271 | -0.0680 | No |
| 2 | Pcsk2 | 4311 | 0.224 | -0.0225 | No |
| 3 | Pklr | 7230 | 0.092 | -0.1337 | No |
| 4 | Mafb | 8513 | 0.040 | -0.1829 | No |
| 5 | Lmo2 | 8833 | 0.027 | -0.1884 | No |
| 6 | Stxbp1 | 9244 | 0.011 | -0.2050 | No |
| 7 | Vdr | 9355 | 0.006 | -0.2081 | No |
| 8 | Chga | 9963 | -0.013 | -0.2336 | No |
| 9 | Elp4 | 10472 | -0.033 | -0.2464 | No |
| 10 | Akt3 | 10509 | -0.034 | -0.2349 | No |
| 11 | Srprb | 10571 | -0.037 | -0.2235 | No |
| 12 | Pak3 | 11192 | -0.062 | -0.2304 | No |
| 13 | Sec11a | 13430 | -0.156 | -0.2820 | No |
| 14 | Srp14 | 17300 | -0.371 | -0.3313 | Yes |
| 15 | Dpp4 | 18713 | -0.519 | -0.1975 | Yes |
| 16 | Spcs1 | 19245 | -0.635 | 0.0266 | Yes |