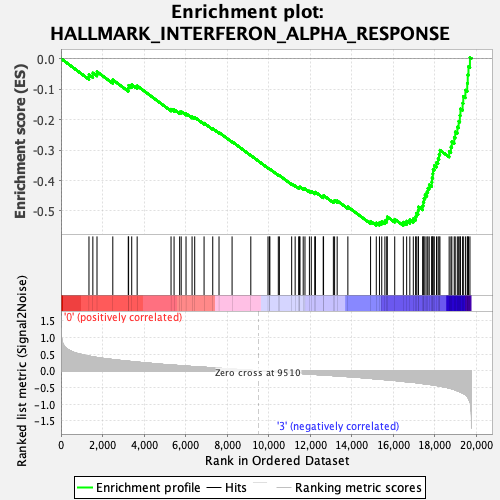
Profile of the Running ES Score & Positions of GeneSet Members on the Rank Ordered List
| Dataset | CMP.CMP_Pheno.cls#Group1_versus_Group4.CMP_Pheno.cls#Group1_versus_Group4_repos |
| Phenotype | CMP_Pheno.cls#Group1_versus_Group4_repos |
| Upregulated in class | 3 |
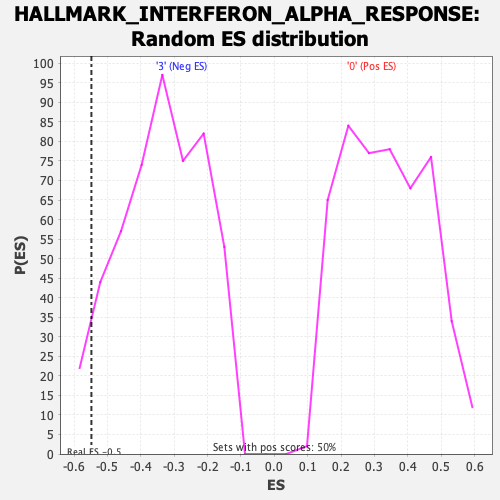
| GeneSet | HALLMARK_INTERFERON_ALPHA_RESPONSE |
| Enrichment Score (ES) | -0.5478736 |
| Normalized Enrichment Score (NES) | -1.6261147 |
| Nominal p-value | 0.04563492 |
| FDR q-value | 0.28948408 |
| FWER p-Value | 0.197 |
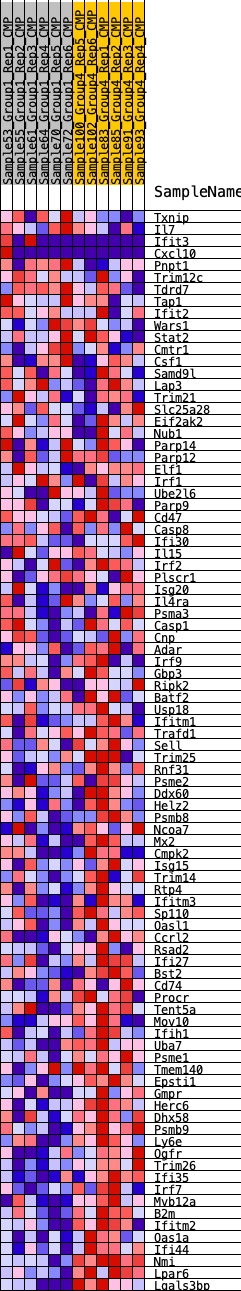
| SYMBOL | RANK IN GENE LIST | RANK METRIC SCORE | RUNNING ES | CORE ENRICHMENT | |
|---|---|---|---|---|---|
| 1 | Txnip | 1347 | 0.439 | -0.0527 | No |
| 2 | Il7 | 1534 | 0.420 | -0.0472 | No |
| 3 | Ifit3 | 1734 | 0.399 | -0.0430 | No |
| 4 | Cxcl10 | 2495 | 0.336 | -0.0696 | No |
| 5 | Pnpt1 | 3240 | 0.287 | -0.0971 | No |
| 6 | Trim12c | 3256 | 0.286 | -0.0876 | No |
| 7 | Tdrd7 | 3406 | 0.276 | -0.0853 | No |
| 8 | Tap1 | 3668 | 0.259 | -0.0893 | No |
| 9 | Ifit2 | 5300 | 0.173 | -0.1660 | No |
| 10 | Wars1 | 5446 | 0.167 | -0.1673 | No |
| 11 | Stat2 | 5715 | 0.154 | -0.1754 | No |
| 12 | Cmtr1 | 5789 | 0.151 | -0.1737 | No |
| 13 | Csf1 | 6022 | 0.141 | -0.1805 | No |
| 14 | Samd9l | 6313 | 0.128 | -0.1906 | No |
| 15 | Lap3 | 6440 | 0.122 | -0.1927 | No |
| 16 | Trim21 | 6891 | 0.107 | -0.2117 | No |
| 17 | Slc25a28 | 7309 | 0.089 | -0.2297 | No |
| 18 | Eif2ak2 | 7611 | 0.077 | -0.2422 | No |
| 19 | Nub1 | 8240 | 0.050 | -0.2724 | No |
| 20 | Parp14 | 9142 | 0.014 | -0.3176 | No |
| 21 | Parp12 | 9970 | -0.013 | -0.3592 | No |
| 22 | Elf1 | 10036 | -0.016 | -0.3619 | No |
| 23 | Irf1 | 10060 | -0.016 | -0.3625 | No |
| 24 | Ube2l6 | 10467 | -0.032 | -0.3820 | No |
| 25 | Parp9 | 10518 | -0.034 | -0.3833 | No |
| 26 | Cd47 | 11110 | -0.058 | -0.4112 | No |
| 27 | Casp8 | 11278 | -0.066 | -0.4173 | No |
| 28 | Ifi30 | 11447 | -0.073 | -0.4233 | No |
| 29 | Il15 | 11491 | -0.075 | -0.4228 | No |
| 30 | Irf2 | 11509 | -0.076 | -0.4209 | No |
| 31 | Plscr1 | 11666 | -0.082 | -0.4259 | No |
| 32 | Isg20 | 11751 | -0.085 | -0.4271 | No |
| 33 | Il4ra | 11965 | -0.095 | -0.4345 | No |
| 34 | Psma3 | 12055 | -0.098 | -0.4356 | No |
| 35 | Casp1 | 12223 | -0.106 | -0.4402 | No |
| 36 | Cnp | 12255 | -0.107 | -0.4380 | No |
| 37 | Adar | 12630 | -0.124 | -0.4525 | No |
| 38 | Irf9 | 12646 | -0.125 | -0.4488 | No |
| 39 | Gbp3 | 13119 | -0.143 | -0.4677 | No |
| 40 | Ripk2 | 13178 | -0.145 | -0.4654 | No |
| 41 | Batf2 | 13302 | -0.150 | -0.4663 | No |
| 42 | Usp18 | 13817 | -0.172 | -0.4862 | No |
| 43 | Ifitm1 | 14911 | -0.226 | -0.5337 | No |
| 44 | Trafd1 | 15186 | -0.240 | -0.5390 | Yes |
| 45 | Sell | 15339 | -0.248 | -0.5379 | Yes |
| 46 | Trim25 | 15449 | -0.255 | -0.5343 | Yes |
| 47 | Rnf31 | 15601 | -0.263 | -0.5325 | Yes |
| 48 | Psme2 | 15691 | -0.268 | -0.5275 | Yes |
| 49 | Ddx60 | 15714 | -0.269 | -0.5189 | Yes |
| 50 | Helz2 | 16074 | -0.288 | -0.5269 | Yes |
| 51 | Psmb8 | 16488 | -0.317 | -0.5365 | Yes |
| 52 | Ncoa7 | 16649 | -0.325 | -0.5330 | Yes |
| 53 | Mx2 | 16802 | -0.333 | -0.5288 | Yes |
| 54 | Cmpk2 | 16969 | -0.342 | -0.5250 | Yes |
| 55 | Isg15 | 17081 | -0.351 | -0.5181 | Yes |
| 56 | Trim14 | 17112 | -0.354 | -0.5069 | Yes |
| 57 | Rtp4 | 17201 | -0.362 | -0.4984 | Yes |
| 58 | Ifitm3 | 17217 | -0.363 | -0.4862 | Yes |
| 59 | Sp110 | 17421 | -0.380 | -0.4829 | Yes |
| 60 | Oasl1 | 17446 | -0.384 | -0.4704 | Yes |
| 61 | Ccrl2 | 17481 | -0.387 | -0.4583 | Yes |
| 62 | Rsad2 | 17533 | -0.389 | -0.4469 | Yes |
| 63 | Ifi27 | 17625 | -0.397 | -0.4373 | Yes |
| 64 | Bst2 | 17671 | -0.401 | -0.4253 | Yes |
| 65 | Cd74 | 17735 | -0.405 | -0.4140 | Yes |
| 66 | Procr | 17855 | -0.414 | -0.4052 | Yes |
| 67 | Tent5a | 17871 | -0.416 | -0.3911 | Yes |
| 68 | Mov10 | 17909 | -0.420 | -0.3779 | Yes |
| 69 | Ifih1 | 17920 | -0.422 | -0.3633 | Yes |
| 70 | Uba7 | 17979 | -0.427 | -0.3510 | Yes |
| 71 | Psme1 | 18086 | -0.438 | -0.3407 | Yes |
| 72 | Tmem140 | 18161 | -0.446 | -0.3285 | Yes |
| 73 | Epsti1 | 18208 | -0.451 | -0.3147 | Yes |
| 74 | Gmpr | 18251 | -0.456 | -0.3005 | Yes |
| 75 | Herc6 | 18696 | -0.516 | -0.3046 | Yes |
| 76 | Dhx58 | 18781 | -0.529 | -0.2899 | Yes |
| 77 | Psmb9 | 18825 | -0.538 | -0.2728 | Yes |
| 78 | Ly6e | 18940 | -0.560 | -0.2585 | Yes |
| 79 | Ogfr | 18987 | -0.570 | -0.2405 | Yes |
| 80 | Trim26 | 19089 | -0.596 | -0.2243 | Yes |
| 81 | Ifi35 | 19154 | -0.610 | -0.2057 | Yes |
| 82 | Irf7 | 19212 | -0.627 | -0.1861 | Yes |
| 83 | Mvb12a | 19239 | -0.634 | -0.1647 | Yes |
| 84 | B2m | 19344 | -0.663 | -0.1463 | Yes |
| 85 | Ifitm2 | 19376 | -0.673 | -0.1238 | Yes |
| 86 | Oas1a | 19478 | -0.713 | -0.1034 | Yes |
| 87 | Ifi44 | 19567 | -0.763 | -0.0805 | Yes |
| 88 | Nmi | 19591 | -0.787 | -0.0535 | Yes |
| 89 | Lpar6 | 19626 | -0.821 | -0.0259 | Yes |
| 90 | Lgals3bp | 19697 | -0.927 | 0.0038 | Yes |