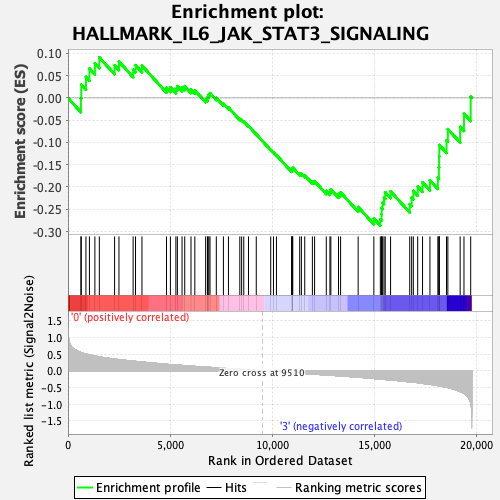
Profile of the Running ES Score & Positions of GeneSet Members on the Rank Ordered List
| Dataset | CMP.CMP_Pheno.cls#Group1_versus_Group4.CMP_Pheno.cls#Group1_versus_Group4_repos |
| Phenotype | CMP_Pheno.cls#Group1_versus_Group4_repos |
| Upregulated in class | 3 |
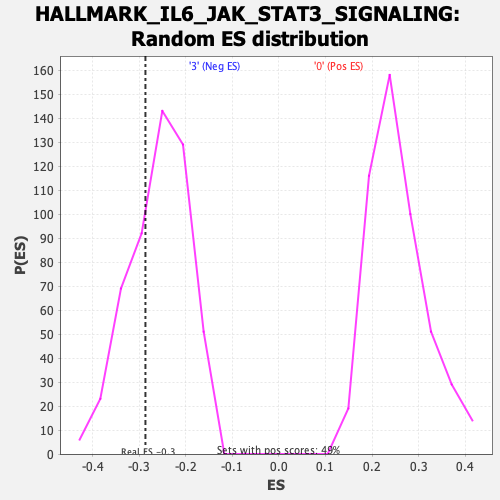
| GeneSet | HALLMARK_IL6_JAK_STAT3_SIGNALING |
| Enrichment Score (ES) | -0.28674155 |
| Normalized Enrichment Score (NES) | -1.1113106 |
| Nominal p-value | 0.29239765 |
| FDR q-value | 0.43357456 |
| FWER p-Value | 0.936 |
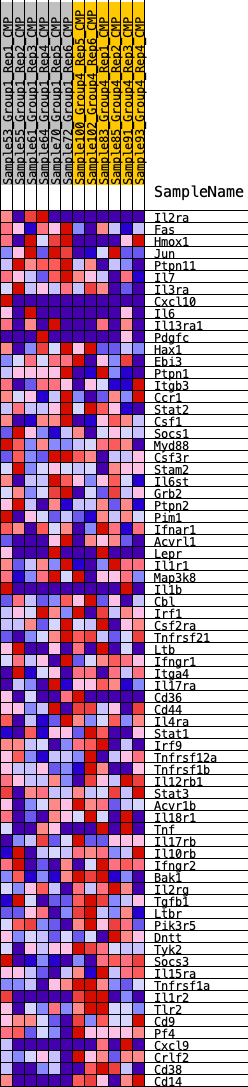
| SYMBOL | RANK IN GENE LIST | RANK METRIC SCORE | RUNNING ES | CORE ENRICHMENT | |
|---|---|---|---|---|---|
| 1 | Il2ra | 631 | 0.550 | -0.0005 | No |
| 2 | Fas | 650 | 0.547 | 0.0299 | No |
| 3 | Hmox1 | 878 | 0.503 | 0.0473 | No |
| 4 | Jun | 1049 | 0.479 | 0.0661 | No |
| 5 | Ptpn11 | 1316 | 0.444 | 0.0780 | No |
| 6 | Il7 | 1534 | 0.420 | 0.0911 | No |
| 7 | Il3ra | 2281 | 0.353 | 0.0734 | No |
| 8 | Cxcl10 | 2495 | 0.336 | 0.0818 | No |
| 9 | Il6 | 3188 | 0.290 | 0.0633 | No |
| 10 | Il13ra1 | 3306 | 0.284 | 0.0737 | No |
| 11 | Pdgfc | 3621 | 0.262 | 0.0727 | No |
| 12 | Hax1 | 4823 | 0.196 | 0.0230 | No |
| 13 | Ebi3 | 5013 | 0.186 | 0.0240 | No |
| 14 | Ptpn1 | 5282 | 0.174 | 0.0204 | No |
| 15 | Itgb3 | 5355 | 0.171 | 0.0265 | No |
| 16 | Ccr1 | 5584 | 0.161 | 0.0242 | No |
| 17 | Stat2 | 5715 | 0.154 | 0.0265 | No |
| 18 | Csf1 | 6022 | 0.141 | 0.0190 | No |
| 19 | Socs1 | 6209 | 0.132 | 0.0171 | No |
| 20 | Myd88 | 6739 | 0.113 | -0.0032 | No |
| 21 | Csf3r | 6828 | 0.110 | -0.0014 | No |
| 22 | Stam2 | 6852 | 0.109 | 0.0037 | No |
| 23 | Il6st | 6897 | 0.107 | 0.0076 | No |
| 24 | Grb2 | 6953 | 0.104 | 0.0108 | No |
| 25 | Ptpn2 | 7261 | 0.091 | 0.0004 | No |
| 26 | Pim1 | 7609 | 0.077 | -0.0128 | No |
| 27 | Ifnar1 | 7856 | 0.066 | -0.0215 | No |
| 28 | Acvrl1 | 8412 | 0.043 | -0.0472 | No |
| 29 | Lepr | 8502 | 0.040 | -0.0494 | No |
| 30 | Il1r1 | 8606 | 0.036 | -0.0526 | No |
| 31 | Map3k8 | 8838 | 0.027 | -0.0628 | No |
| 32 | Il1b | 9217 | 0.011 | -0.0814 | No |
| 33 | Cbl | 9925 | -0.012 | -0.1166 | No |
| 34 | Irf1 | 10060 | -0.016 | -0.1225 | No |
| 35 | Csf2ra | 10205 | -0.022 | -0.1285 | No |
| 36 | Tnfrsf21 | 10947 | -0.052 | -0.1632 | No |
| 37 | Ltb | 10970 | -0.053 | -0.1613 | No |
| 38 | Ifngr1 | 10986 | -0.053 | -0.1590 | No |
| 39 | Itga4 | 11004 | -0.054 | -0.1567 | No |
| 40 | Il17ra | 11345 | -0.068 | -0.1700 | No |
| 41 | Cd36 | 11427 | -0.072 | -0.1700 | No |
| 42 | Cd44 | 11591 | -0.080 | -0.1737 | No |
| 43 | Il4ra | 11965 | -0.095 | -0.1872 | No |
| 44 | Stat1 | 12073 | -0.099 | -0.1870 | No |
| 45 | Irf9 | 12646 | -0.125 | -0.2088 | No |
| 46 | Tnfrsf12a | 12824 | -0.129 | -0.2104 | No |
| 47 | Tnfrsf1b | 12870 | -0.131 | -0.2052 | No |
| 48 | Il12rb1 | 13244 | -0.148 | -0.2157 | No |
| 49 | Stat3 | 13346 | -0.152 | -0.2121 | No |
| 50 | Acvr1b | 14206 | -0.188 | -0.2449 | No |
| 51 | Il18r1 | 14975 | -0.230 | -0.2707 | No |
| 52 | Tnf | 15292 | -0.244 | -0.2727 | Yes |
| 53 | Il17rb | 15351 | -0.249 | -0.2614 | Yes |
| 54 | Il10rb | 15355 | -0.249 | -0.2473 | Yes |
| 55 | Ifngr2 | 15404 | -0.252 | -0.2353 | Yes |
| 56 | Bak1 | 15472 | -0.256 | -0.2240 | Yes |
| 57 | Il2rg | 15532 | -0.259 | -0.2121 | Yes |
| 58 | Tgfb1 | 15794 | -0.272 | -0.2098 | Yes |
| 59 | Ltbr | 16732 | -0.330 | -0.2384 | Yes |
| 60 | Pik3r5 | 16826 | -0.334 | -0.2240 | Yes |
| 61 | Dntt | 16908 | -0.340 | -0.2086 | Yes |
| 62 | Tyk2 | 17121 | -0.355 | -0.1990 | Yes |
| 63 | Socs3 | 17359 | -0.375 | -0.1896 | Yes |
| 64 | Il15ra | 17721 | -0.403 | -0.1848 | Yes |
| 65 | Tnfrsf1a | 18109 | -0.440 | -0.1792 | Yes |
| 66 | Il1r2 | 18157 | -0.446 | -0.1560 | Yes |
| 67 | Tlr2 | 18171 | -0.447 | -0.1310 | Yes |
| 68 | Cd9 | 18179 | -0.448 | -0.1057 | Yes |
| 69 | Pf4 | 18532 | -0.492 | -0.0954 | Yes |
| 70 | Cxcl9 | 18598 | -0.501 | -0.0700 | Yes |
| 71 | Crlf2 | 19200 | -0.623 | -0.0648 | Yes |
| 72 | Cd38 | 19387 | -0.676 | -0.0354 | Yes |
| 73 | Cd14 | 19716 | -0.957 | 0.0028 | Yes |