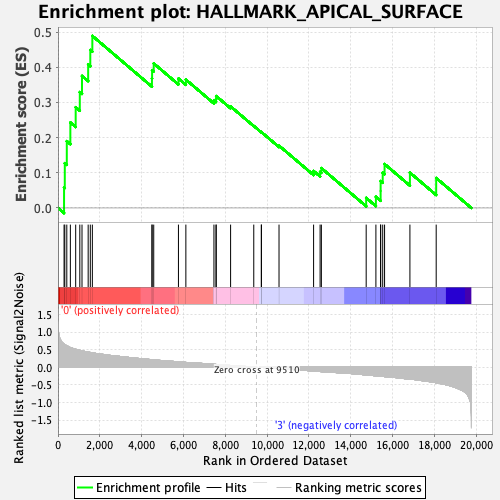
Profile of the Running ES Score & Positions of GeneSet Members on the Rank Ordered List
| Dataset | CMP.CMP_Pheno.cls#Group1_versus_Group4.CMP_Pheno.cls#Group1_versus_Group4_repos |
| Phenotype | CMP_Pheno.cls#Group1_versus_Group4_repos |
| Upregulated in class | 0 |
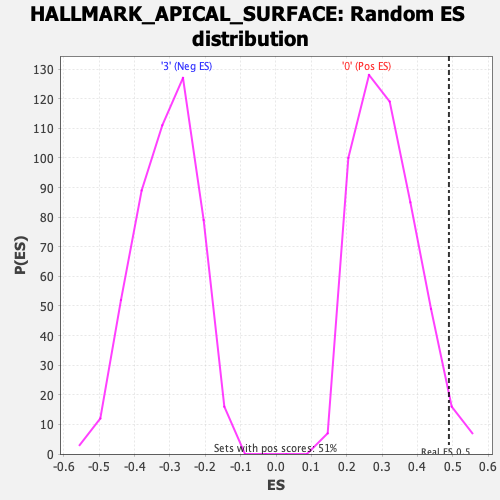
| GeneSet | HALLMARK_APICAL_SURFACE |
| Enrichment Score (ES) | 0.48902693 |
| Normalized Enrichment Score (NES) | 1.5692716 |
| Nominal p-value | 0.029354207 |
| FDR q-value | 0.2085432 |
| FWER p-Value | 0.268 |
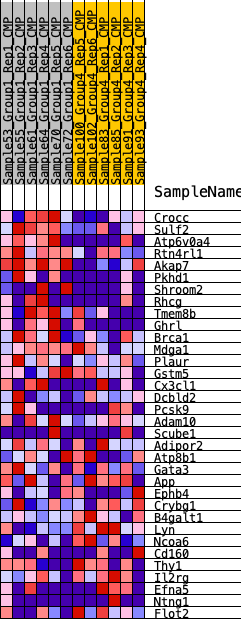
| SYMBOL | RANK IN GENE LIST | RANK METRIC SCORE | RUNNING ES | CORE ENRICHMENT | |
|---|---|---|---|---|---|
| 1 | Crocc | 290 | 0.658 | 0.0580 | Yes |
| 2 | Sulf2 | 325 | 0.643 | 0.1272 | Yes |
| 3 | Atp6v0a4 | 421 | 0.611 | 0.1899 | Yes |
| 4 | Rtn4rl1 | 591 | 0.558 | 0.2429 | Yes |
| 5 | Akap7 | 846 | 0.509 | 0.2863 | Yes |
| 6 | Pkhd1 | 1043 | 0.480 | 0.3293 | Yes |
| 7 | Shroom2 | 1148 | 0.464 | 0.3753 | Yes |
| 8 | Rhcg | 1443 | 0.430 | 0.4079 | Yes |
| 9 | Tmem8b | 1545 | 0.418 | 0.4489 | Yes |
| 10 | Ghrl | 1643 | 0.408 | 0.4890 | Yes |
| 11 | Brca1 | 4494 | 0.214 | 0.3683 | No |
| 12 | Mdga1 | 4501 | 0.214 | 0.3916 | No |
| 13 | Plaur | 4579 | 0.209 | 0.4108 | No |
| 14 | Gstm5 | 5761 | 0.152 | 0.3678 | No |
| 15 | Cx3cl1 | 6116 | 0.136 | 0.3649 | No |
| 16 | Dcbld2 | 7459 | 0.083 | 0.3060 | No |
| 17 | Pcsk9 | 7559 | 0.079 | 0.3097 | No |
| 18 | Adam10 | 7567 | 0.078 | 0.3180 | No |
| 19 | Scube1 | 8256 | 0.050 | 0.2886 | No |
| 20 | Adipor2 | 9364 | 0.006 | 0.2331 | No |
| 21 | Atp8b1 | 9727 | -0.004 | 0.2153 | No |
| 22 | Gata3 | 9729 | -0.004 | 0.2157 | No |
| 23 | App | 10572 | -0.037 | 0.1771 | No |
| 24 | Ephb4 | 12226 | -0.106 | 0.1051 | No |
| 25 | Crybg1 | 12537 | -0.121 | 0.1027 | No |
| 26 | B4galt1 | 12598 | -0.123 | 0.1133 | No |
| 27 | Lyn | 14741 | -0.217 | 0.0287 | No |
| 28 | Ncoa6 | 15206 | -0.241 | 0.0318 | No |
| 29 | Cd160 | 15432 | -0.254 | 0.0484 | No |
| 30 | Thy1 | 15433 | -0.254 | 0.0765 | No |
| 31 | Il2rg | 15532 | -0.259 | 0.1001 | No |
| 32 | Efna5 | 15621 | -0.264 | 0.1249 | No |
| 33 | Ntng1 | 16833 | -0.334 | 0.1004 | No |
| 34 | Flot2 | 18090 | -0.438 | 0.0852 | No |