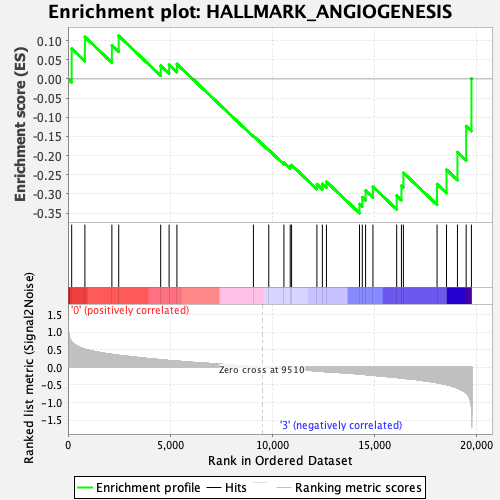
Profile of the Running ES Score & Positions of GeneSet Members on the Rank Ordered List
| Dataset | CMP.CMP_Pheno.cls#Group1_versus_Group4.CMP_Pheno.cls#Group1_versus_Group4_repos |
| Phenotype | CMP_Pheno.cls#Group1_versus_Group4_repos |
| Upregulated in class | 3 |
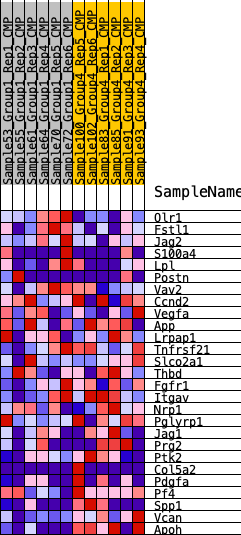
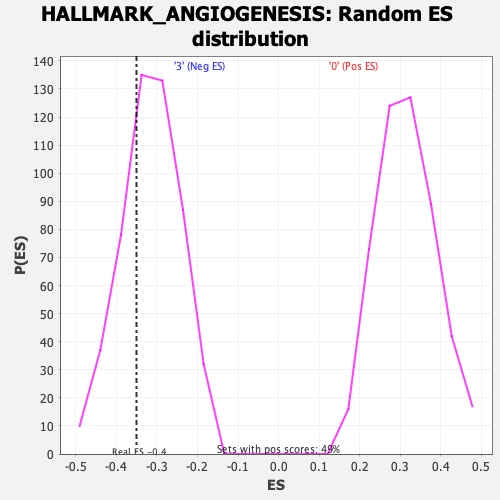
| GeneSet | HALLMARK_ANGIOGENESIS |
| Enrichment Score (ES) | -0.35023263 |
| Normalized Enrichment Score (NES) | -1.1125906 |
| Nominal p-value | 0.28515625 |
| FDR q-value | 0.46265337 |
| FWER p-Value | 0.936 |
| SYMBOL | RANK IN GENE LIST | RANK METRIC SCORE | RUNNING ES | CORE ENRICHMENT | |
|---|---|---|---|---|---|
| 1 | Olr1 | 180 | 0.714 | 0.0792 | No |
| 2 | Fstl1 | 827 | 0.511 | 0.1096 | No |
| 3 | Jag2 | 2148 | 0.365 | 0.0878 | No |
| 4 | S100a4 | 2483 | 0.336 | 0.1124 | No |
| 5 | Lpl | 4538 | 0.212 | 0.0345 | No |
| 6 | Postn | 4950 | 0.189 | 0.0371 | No |
| 7 | Vav2 | 5332 | 0.172 | 0.0391 | No |
| 8 | Ccnd2 | 9078 | 0.017 | -0.1485 | No |
| 9 | Vegfa | 9830 | -0.009 | -0.1854 | No |
| 10 | App | 10572 | -0.037 | -0.2184 | No |
| 11 | Lrpap1 | 10880 | -0.049 | -0.2278 | No |
| 12 | Tnfrsf21 | 10947 | -0.052 | -0.2248 | No |
| 13 | Slco2a1 | 12187 | -0.104 | -0.2746 | No |
| 14 | Thbd | 12454 | -0.116 | -0.2737 | No |
| 15 | Fgfr1 | 12653 | -0.125 | -0.2682 | No |
| 16 | Itgav | 14273 | -0.191 | -0.3266 | Yes |
| 17 | Nrp1 | 14409 | -0.199 | -0.3088 | Yes |
| 18 | Pglyrp1 | 14570 | -0.208 | -0.2913 | Yes |
| 19 | Jag1 | 14930 | -0.226 | -0.2815 | Yes |
| 20 | Prg2 | 16093 | -0.289 | -0.3047 | Yes |
| 21 | Ptk2 | 16325 | -0.305 | -0.2787 | Yes |
| 22 | Col5a2 | 16421 | -0.313 | -0.2448 | Yes |
| 23 | Pdgfa | 18070 | -0.437 | -0.2743 | Yes |
| 24 | Pf4 | 18532 | -0.492 | -0.2369 | Yes |
| 25 | Spp1 | 19068 | -0.591 | -0.1909 | Yes |
| 26 | Vcan | 19495 | -0.724 | -0.1230 | Yes |
| 27 | Apoh | 19752 | -1.108 | 0.0010 | Yes |