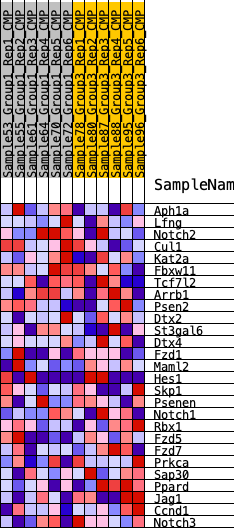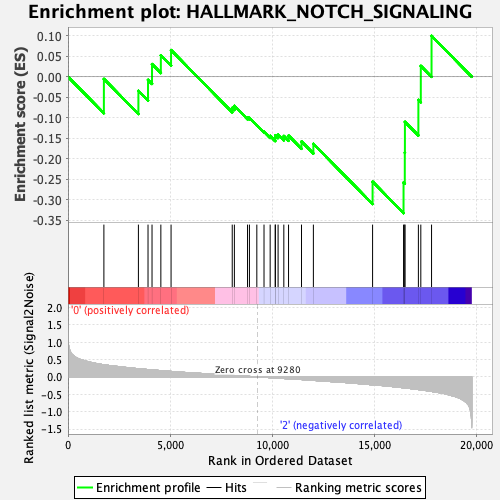
Profile of the Running ES Score & Positions of GeneSet Members on the Rank Ordered List
| Dataset | CMP.CMP_Pheno.cls#Group1_versus_Group3.CMP_Pheno.cls#Group1_versus_Group3_repos |
| Phenotype | CMP_Pheno.cls#Group1_versus_Group3_repos |
| Upregulated in class | 2 |
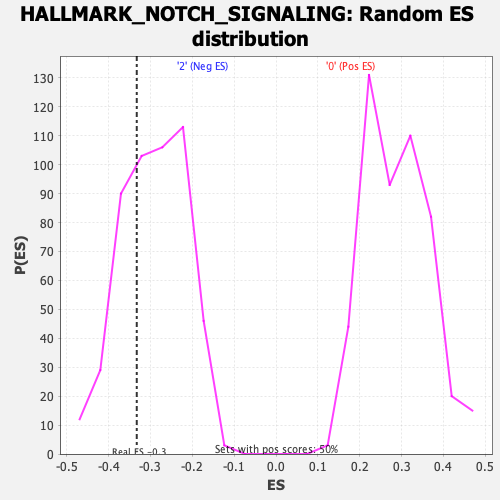
| GeneSet | HALLMARK_NOTCH_SIGNALING |
| Enrichment Score (ES) | -0.33277088 |
| Normalized Enrichment Score (NES) | -1.1440451 |
| Nominal p-value | 0.29681274 |
| FDR q-value | 0.7216214 |
| FWER p-Value | 0.955 |
| SYMBOL | RANK IN GENE LIST | RANK METRIC SCORE | RUNNING ES | CORE ENRICHMENT | |
|---|---|---|---|---|---|
| 1 | Aph1a | 1757 | 0.349 | -0.0053 | No |
| 2 | Lfng | 3447 | 0.236 | -0.0344 | No |
| 3 | Notch2 | 3918 | 0.211 | -0.0075 | No |
| 4 | Cul1 | 4114 | 0.202 | 0.0309 | No |
| 5 | Kat2a | 4546 | 0.181 | 0.0524 | No |
| 6 | Fbxw11 | 5046 | 0.158 | 0.0650 | No |
| 7 | Tcf7l2 | 8041 | 0.045 | -0.0758 | No |
| 8 | Arrb1 | 8146 | 0.042 | -0.0710 | No |
| 9 | Psen2 | 8790 | 0.019 | -0.0992 | No |
| 10 | Dtx2 | 8883 | 0.015 | -0.1003 | No |
| 11 | St3gal6 | 9245 | 0.002 | -0.1182 | No |
| 12 | Dtx4 | 9597 | -0.008 | -0.1340 | No |
| 13 | Fzd1 | 9898 | -0.021 | -0.1443 | No |
| 14 | Maml2 | 10147 | -0.030 | -0.1497 | No |
| 15 | Hes1 | 10152 | -0.030 | -0.1428 | No |
| 16 | Skp1 | 10286 | -0.035 | -0.1412 | No |
| 17 | Psenen | 10567 | -0.045 | -0.1446 | No |
| 18 | Notch1 | 10798 | -0.053 | -0.1436 | No |
| 19 | Rbx1 | 11433 | -0.074 | -0.1580 | No |
| 20 | Fzd5 | 12014 | -0.099 | -0.1637 | No |
| 21 | Fzd7 | 14913 | -0.227 | -0.2560 | No |
| 22 | Prkca | 16429 | -0.312 | -0.2580 | Yes |
| 23 | Sap30 | 16490 | -0.316 | -0.1854 | Yes |
| 24 | Ppard | 16496 | -0.316 | -0.1100 | Yes |
| 25 | Jag1 | 17155 | -0.362 | -0.0565 | Yes |
| 26 | Ccnd1 | 17274 | -0.372 | 0.0265 | Yes |
| 27 | Notch3 | 17800 | -0.417 | 0.0998 | Yes |