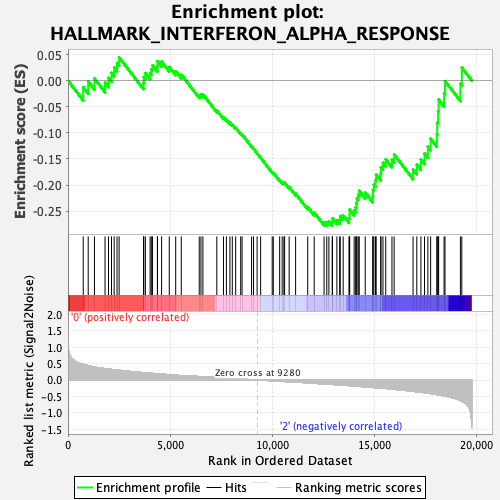
Profile of the Running ES Score & Positions of GeneSet Members on the Rank Ordered List
| Dataset | CMP.CMP_Pheno.cls#Group1_versus_Group3.CMP_Pheno.cls#Group1_versus_Group3_repos |
| Phenotype | CMP_Pheno.cls#Group1_versus_Group3_repos |
| Upregulated in class | 2 |
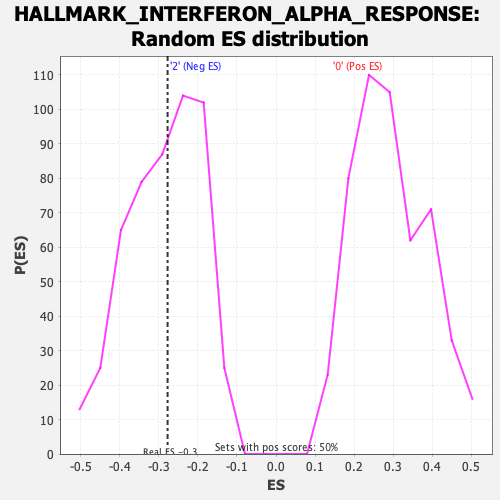
| GeneSet | HALLMARK_INTERFERON_ALPHA_RESPONSE |
| Enrichment Score (ES) | -0.27756315 |
| Normalized Enrichment Score (NES) | -0.9673875 |
| Nominal p-value | 0.492 |
| FDR q-value | 0.84178805 |
| FWER p-Value | 1.0 |
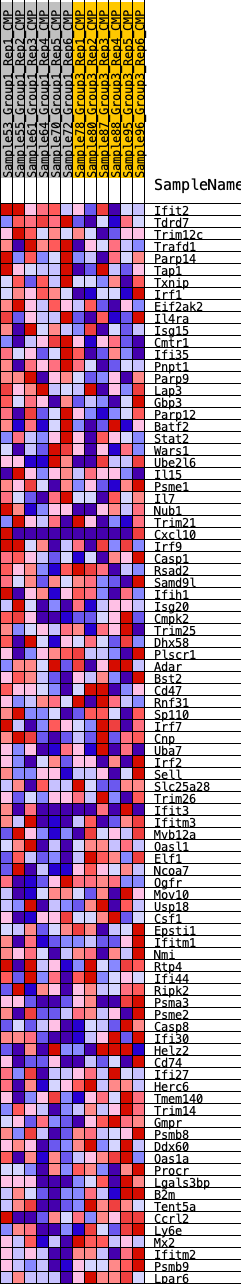
| SYMBOL | RANK IN GENE LIST | RANK METRIC SCORE | RUNNING ES | CORE ENRICHMENT | |
|---|---|---|---|---|---|
| 1 | Ifit2 | 746 | 0.477 | -0.0126 | No |
| 2 | Tdrd7 | 989 | 0.438 | -0.0016 | No |
| 3 | Trim12c | 1295 | 0.398 | 0.0041 | No |
| 4 | Trafd1 | 1813 | 0.345 | -0.0038 | No |
| 5 | Parp14 | 1982 | 0.332 | 0.0053 | No |
| 6 | Tap1 | 2130 | 0.321 | 0.0149 | No |
| 7 | Txnip | 2260 | 0.312 | 0.0249 | No |
| 8 | Irf1 | 2401 | 0.302 | 0.0338 | No |
| 9 | Eif2ak2 | 2502 | 0.296 | 0.0445 | No |
| 10 | Il4ra | 3696 | 0.223 | -0.0043 | No |
| 11 | Isg15 | 3712 | 0.222 | 0.0068 | No |
| 12 | Cmtr1 | 3788 | 0.218 | 0.0145 | No |
| 13 | Ifi35 | 4020 | 0.206 | 0.0138 | No |
| 14 | Pnpt1 | 4079 | 0.203 | 0.0216 | No |
| 15 | Parp9 | 4140 | 0.200 | 0.0292 | No |
| 16 | Lap3 | 4377 | 0.189 | 0.0273 | No |
| 17 | Gbp3 | 4381 | 0.189 | 0.0372 | No |
| 18 | Parp12 | 4582 | 0.179 | 0.0366 | No |
| 19 | Batf2 | 4958 | 0.162 | 0.0262 | No |
| 20 | Stat2 | 5273 | 0.148 | 0.0181 | No |
| 21 | Wars1 | 5546 | 0.135 | 0.0115 | No |
| 22 | Ube2l6 | 6426 | 0.104 | -0.0277 | No |
| 23 | Il15 | 6510 | 0.101 | -0.0265 | No |
| 24 | Psme1 | 6605 | 0.097 | -0.0261 | No |
| 25 | Il7 | 7286 | 0.072 | -0.0568 | No |
| 26 | Nub1 | 7612 | 0.059 | -0.0702 | No |
| 27 | Trim21 | 7756 | 0.055 | -0.0746 | No |
| 28 | Cxcl10 | 7927 | 0.050 | -0.0806 | No |
| 29 | Irf9 | 8044 | 0.045 | -0.0841 | No |
| 30 | Casp1 | 8209 | 0.039 | -0.0903 | No |
| 31 | Rsad2 | 8455 | 0.030 | -0.1012 | No |
| 32 | Samd9l | 8523 | 0.028 | -0.1030 | No |
| 33 | Ifih1 | 8988 | 0.011 | -0.1261 | No |
| 34 | Isg20 | 9083 | 0.008 | -0.1304 | No |
| 35 | Cmpk2 | 9259 | 0.001 | -0.1393 | No |
| 36 | Trim25 | 9431 | -0.003 | -0.1478 | No |
| 37 | Dhx58 | 9998 | -0.024 | -0.1753 | No |
| 38 | Plscr1 | 10051 | -0.026 | -0.1766 | No |
| 39 | Adar | 10363 | -0.038 | -0.1904 | No |
| 40 | Bst2 | 10486 | -0.042 | -0.1943 | No |
| 41 | Cd47 | 10571 | -0.045 | -0.1962 | No |
| 42 | Rnf31 | 10606 | -0.046 | -0.1954 | No |
| 43 | Sp110 | 10828 | -0.054 | -0.2038 | No |
| 44 | Irf7 | 11144 | -0.063 | -0.2165 | No |
| 45 | Cnp | 11737 | -0.086 | -0.2420 | No |
| 46 | Uba7 | 12054 | -0.100 | -0.2527 | No |
| 47 | Irf2 | 12538 | -0.119 | -0.2709 | No |
| 48 | Sell | 12670 | -0.125 | -0.2709 | Yes |
| 49 | Slc25a28 | 12774 | -0.129 | -0.2693 | Yes |
| 50 | Trim26 | 12936 | -0.135 | -0.2703 | Yes |
| 51 | Ifit3 | 12949 | -0.136 | -0.2637 | Yes |
| 52 | Ifitm3 | 13165 | -0.143 | -0.2670 | Yes |
| 53 | Mvb12a | 13303 | -0.149 | -0.2660 | Yes |
| 54 | Oasl1 | 13328 | -0.151 | -0.2592 | Yes |
| 55 | Elf1 | 13472 | -0.157 | -0.2581 | Yes |
| 56 | Ncoa7 | 13757 | -0.169 | -0.2636 | Yes |
| 57 | Ogfr | 13787 | -0.171 | -0.2560 | Yes |
| 58 | Mov10 | 13788 | -0.171 | -0.2469 | Yes |
| 59 | Usp18 | 14010 | -0.182 | -0.2484 | Yes |
| 60 | Csf1 | 14086 | -0.185 | -0.2424 | Yes |
| 61 | Epsti1 | 14115 | -0.187 | -0.2339 | Yes |
| 62 | Ifitm1 | 14149 | -0.188 | -0.2256 | Yes |
| 63 | Nmi | 14210 | -0.191 | -0.2185 | Yes |
| 64 | Rtp4 | 14261 | -0.193 | -0.2107 | Yes |
| 65 | Ifi44 | 14552 | -0.209 | -0.2144 | Yes |
| 66 | Ripk2 | 14923 | -0.228 | -0.2210 | Yes |
| 67 | Psma3 | 14930 | -0.228 | -0.2092 | Yes |
| 68 | Psme2 | 14976 | -0.231 | -0.1992 | Yes |
| 69 | Casp8 | 15058 | -0.233 | -0.1910 | Yes |
| 70 | Ifi30 | 15087 | -0.235 | -0.1799 | Yes |
| 71 | Helz2 | 15313 | -0.244 | -0.1783 | Yes |
| 72 | Cd74 | 15321 | -0.244 | -0.1657 | Yes |
| 73 | Ifi27 | 15420 | -0.250 | -0.1574 | Yes |
| 74 | Herc6 | 15556 | -0.258 | -0.1506 | Yes |
| 75 | Tmem140 | 15862 | -0.276 | -0.1514 | Yes |
| 76 | Trim14 | 15969 | -0.284 | -0.1417 | Yes |
| 77 | Gmpr | 16895 | -0.344 | -0.1704 | Yes |
| 78 | Psmb8 | 17078 | -0.357 | -0.1607 | Yes |
| 79 | Ddx60 | 17279 | -0.372 | -0.1511 | Yes |
| 80 | Oas1a | 17455 | -0.387 | -0.1394 | Yes |
| 81 | Procr | 17621 | -0.401 | -0.1265 | Yes |
| 82 | Lgals3bp | 17755 | -0.414 | -0.1112 | Yes |
| 83 | B2m | 18059 | -0.442 | -0.1031 | Yes |
| 84 | Tent5a | 18077 | -0.443 | -0.0804 | Yes |
| 85 | Ccrl2 | 18120 | -0.446 | -0.0588 | Yes |
| 86 | Ly6e | 18147 | -0.449 | -0.0362 | Yes |
| 87 | Mx2 | 18413 | -0.478 | -0.0243 | Yes |
| 88 | Ifitm2 | 18458 | -0.483 | -0.0008 | Yes |
| 89 | Psmb9 | 19212 | -0.622 | -0.0060 | Yes |
| 90 | Lpar6 | 19282 | -0.646 | 0.0248 | Yes |