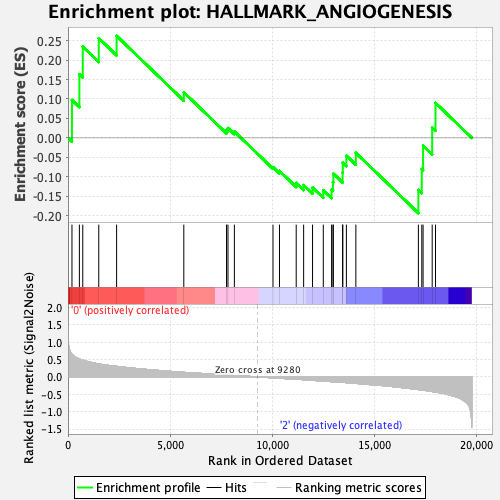
Profile of the Running ES Score & Positions of GeneSet Members on the Rank Ordered List
| Dataset | CMP.CMP_Pheno.cls#Group1_versus_Group3.CMP_Pheno.cls#Group1_versus_Group3_repos |
| Phenotype | CMP_Pheno.cls#Group1_versus_Group3_repos |
| Upregulated in class | 0 |
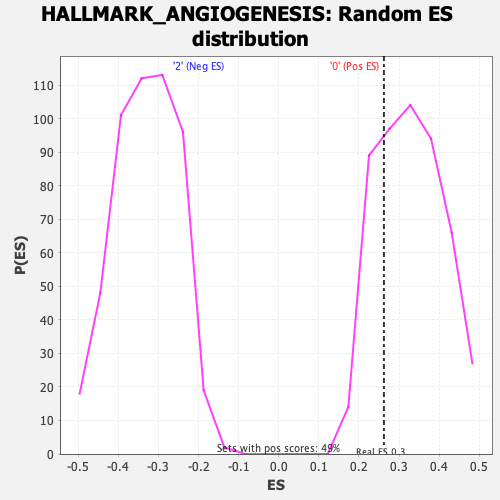
| GeneSet | HALLMARK_ANGIOGENESIS |
| Enrichment Score (ES) | 0.2622319 |
| Normalized Enrichment Score (NES) | 0.802718 |
| Nominal p-value | 0.7556008 |
| FDR q-value | 1.0 |
| FWER p-Value | 1.0 |
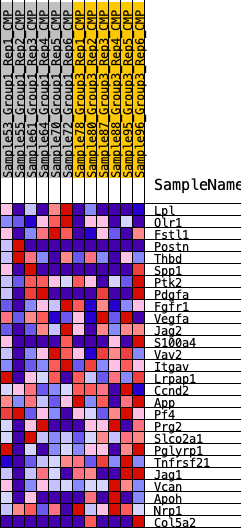
| SYMBOL | RANK IN GENE LIST | RANK METRIC SCORE | RUNNING ES | CORE ENRICHMENT | |
|---|---|---|---|---|---|
| 1 | Lpl | 194 | 0.651 | 0.0975 | Yes |
| 2 | Olr1 | 557 | 0.512 | 0.1636 | Yes |
| 3 | Fstl1 | 723 | 0.481 | 0.2346 | Yes |
| 4 | Postn | 1506 | 0.372 | 0.2563 | Yes |
| 5 | Thbd | 2380 | 0.304 | 0.2622 | Yes |
| 6 | Spp1 | 5670 | 0.131 | 0.1172 | No |
| 7 | Ptk2 | 7762 | 0.054 | 0.0203 | No |
| 8 | Pdgfa | 7832 | 0.052 | 0.0254 | No |
| 9 | Fgfr1 | 8145 | 0.042 | 0.0165 | No |
| 10 | Vegfa | 10036 | -0.025 | -0.0750 | No |
| 11 | Jag2 | 10354 | -0.037 | -0.0849 | No |
| 12 | S100a4 | 11173 | -0.064 | -0.1158 | No |
| 13 | Vav2 | 11537 | -0.078 | -0.1213 | No |
| 14 | Itgav | 11973 | -0.097 | -0.1274 | No |
| 15 | Lrpap1 | 12499 | -0.118 | -0.1345 | No |
| 16 | Ccnd2 | 12905 | -0.134 | -0.1329 | No |
| 17 | App | 12973 | -0.137 | -0.1136 | No |
| 18 | Pf4 | 12992 | -0.138 | -0.0918 | No |
| 19 | Prg2 | 13445 | -0.156 | -0.0891 | No |
| 20 | Slco2a1 | 13454 | -0.156 | -0.0637 | No |
| 21 | Pglyrp1 | 13630 | -0.163 | -0.0456 | No |
| 22 | Tnfrsf21 | 14094 | -0.186 | -0.0384 | No |
| 23 | Jag1 | 17155 | -0.362 | -0.1336 | No |
| 24 | Vcan | 17322 | -0.376 | -0.0800 | No |
| 25 | Apoh | 17385 | -0.382 | -0.0202 | No |
| 26 | Nrp1 | 17831 | -0.420 | 0.0265 | No |
| 27 | Col5a2 | 17993 | -0.434 | 0.0900 | No |