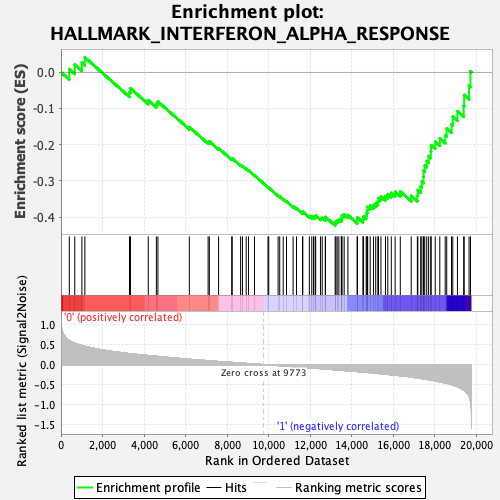
Profile of the Running ES Score & Positions of GeneSet Members on the Rank Ordered List
| Dataset | CMP.Basophil_Pheno.cls #Group1_versus_Group2.Basophil_Pheno.cls #Group1_versus_Group2_repos |
| Phenotype | Basophil_Pheno.cls#Group1_versus_Group2_repos |
| Upregulated in class | 1 |
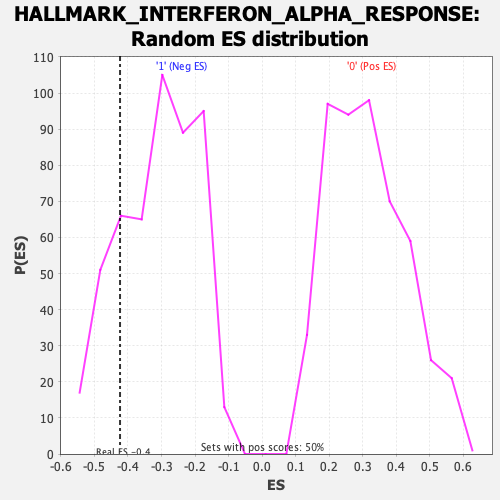
| GeneSet | HALLMARK_INTERFERON_ALPHA_RESPONSE |
| Enrichment Score (ES) | -0.4237192 |
| Normalized Enrichment Score (NES) | -1.3711773 |
| Nominal p-value | 0.1756487 |
| FDR q-value | 0.23865797 |
| FWER p-Value | 0.652 |
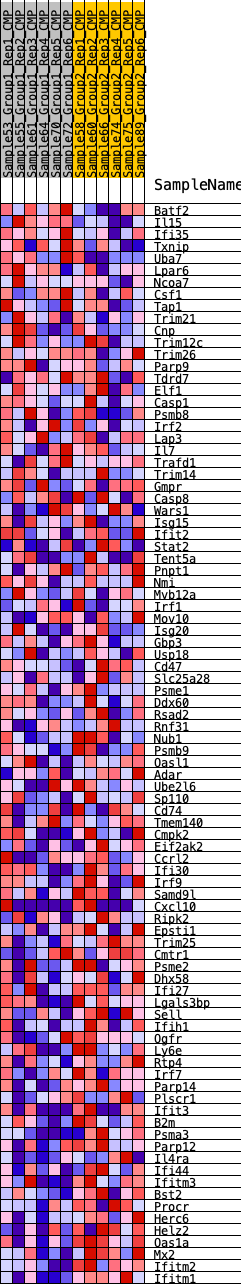
| SYMBOL | RANK IN GENE LIST | RANK METRIC SCORE | RUNNING ES | CORE ENRICHMENT | |
|---|---|---|---|---|---|
| 1 | Batf2 | 400 | 0.608 | 0.0085 | No |
| 2 | Il15 | 662 | 0.542 | 0.0210 | No |
| 3 | Ifi35 | 1006 | 0.480 | 0.0264 | No |
| 4 | Txnip | 1149 | 0.458 | 0.0409 | No |
| 5 | Uba7 | 3299 | 0.276 | -0.0552 | No |
| 6 | Lpar6 | 3345 | 0.273 | -0.0445 | No |
| 7 | Ncoa7 | 4203 | 0.229 | -0.0772 | No |
| 8 | Csf1 | 4593 | 0.210 | -0.0870 | No |
| 9 | Tap1 | 4668 | 0.205 | -0.0810 | No |
| 10 | Trim21 | 6181 | 0.135 | -0.1515 | No |
| 11 | Cnp | 7086 | 0.098 | -0.1927 | No |
| 12 | Trim12c | 7145 | 0.096 | -0.1911 | No |
| 13 | Trim26 | 7590 | 0.078 | -0.2100 | No |
| 14 | Parp9 | 8224 | 0.056 | -0.2395 | No |
| 15 | Tdrd7 | 8245 | 0.055 | -0.2379 | No |
| 16 | Elf1 | 8652 | 0.040 | -0.2566 | No |
| 17 | Casp1 | 8739 | 0.038 | -0.2592 | No |
| 18 | Psmb8 | 8919 | 0.031 | -0.2668 | No |
| 19 | Irf2 | 9030 | 0.027 | -0.2712 | No |
| 20 | Lap3 | 9319 | 0.017 | -0.2850 | No |
| 21 | Il7 | 9970 | -0.005 | -0.3178 | No |
| 22 | Trafd1 | 10006 | -0.006 | -0.3192 | No |
| 23 | Trim14 | 10457 | -0.023 | -0.3410 | No |
| 24 | Gmpr | 10535 | -0.025 | -0.3437 | No |
| 25 | Casp8 | 10703 | -0.032 | -0.3507 | No |
| 26 | Wars1 | 10862 | -0.038 | -0.3569 | No |
| 27 | Isg15 | 11179 | -0.050 | -0.3706 | No |
| 28 | Ifit2 | 11342 | -0.056 | -0.3761 | No |
| 29 | Stat2 | 11638 | -0.066 | -0.3880 | No |
| 30 | Tent5a | 11643 | -0.066 | -0.3851 | No |
| 31 | Pnpt1 | 11961 | -0.078 | -0.3975 | No |
| 32 | Nmi | 12079 | -0.084 | -0.3995 | No |
| 33 | Mvb12a | 12165 | -0.087 | -0.3997 | No |
| 34 | Irf1 | 12240 | -0.090 | -0.3992 | No |
| 35 | Mov10 | 12266 | -0.091 | -0.3961 | No |
| 36 | Isg20 | 12497 | -0.099 | -0.4031 | No |
| 37 | Gbp3 | 12582 | -0.103 | -0.4025 | No |
| 38 | Usp18 | 12732 | -0.109 | -0.4050 | No |
| 39 | Cd47 | 12736 | -0.109 | -0.3999 | No |
| 40 | Slc25a28 | 13205 | -0.129 | -0.4176 | Yes |
| 41 | Psme1 | 13241 | -0.131 | -0.4131 | Yes |
| 42 | Ddx60 | 13302 | -0.134 | -0.4098 | Yes |
| 43 | Rsad2 | 13384 | -0.137 | -0.4074 | Yes |
| 44 | Rnf31 | 13500 | -0.141 | -0.4066 | Yes |
| 45 | Nub1 | 13518 | -0.142 | -0.4007 | Yes |
| 46 | Psmb9 | 13535 | -0.142 | -0.3948 | Yes |
| 47 | Oasl1 | 13638 | -0.146 | -0.3930 | Yes |
| 48 | Adar | 13819 | -0.154 | -0.3948 | Yes |
| 49 | Ube2l6 | 14264 | -0.173 | -0.4092 | Yes |
| 50 | Sp110 | 14278 | -0.173 | -0.4016 | Yes |
| 51 | Cd74 | 14542 | -0.185 | -0.4062 | Yes |
| 52 | Tmem140 | 14572 | -0.186 | -0.3988 | Yes |
| 53 | Cmpk2 | 14700 | -0.191 | -0.3962 | Yes |
| 54 | Eif2ak2 | 14730 | -0.193 | -0.3886 | Yes |
| 55 | Ccrl2 | 14755 | -0.194 | -0.3806 | Yes |
| 56 | Ifi30 | 14771 | -0.195 | -0.3721 | Yes |
| 57 | Irf9 | 14893 | -0.201 | -0.3687 | Yes |
| 58 | Samd9l | 15050 | -0.208 | -0.3668 | Yes |
| 59 | Cxcl10 | 15159 | -0.213 | -0.3621 | Yes |
| 60 | Ripk2 | 15262 | -0.219 | -0.3569 | Yes |
| 61 | Epsti1 | 15291 | -0.220 | -0.3479 | Yes |
| 62 | Trim25 | 15411 | -0.227 | -0.3432 | Yes |
| 63 | Cmtr1 | 15628 | -0.238 | -0.3428 | Yes |
| 64 | Psme2 | 15741 | -0.245 | -0.3369 | Yes |
| 65 | Dhx58 | 15908 | -0.254 | -0.3333 | Yes |
| 66 | Ifi27 | 16094 | -0.264 | -0.3302 | Yes |
| 67 | Lgals3bp | 16342 | -0.277 | -0.3296 | Yes |
| 68 | Sell | 16868 | -0.311 | -0.3415 | Yes |
| 69 | Ifih1 | 17164 | -0.335 | -0.3406 | Yes |
| 70 | Ogfr | 17186 | -0.337 | -0.3256 | Yes |
| 71 | Ly6e | 17326 | -0.348 | -0.3162 | Yes |
| 72 | Rtp4 | 17380 | -0.351 | -0.3022 | Yes |
| 73 | Irf7 | 17458 | -0.358 | -0.2892 | Yes |
| 74 | Parp14 | 17468 | -0.359 | -0.2726 | Yes |
| 75 | Plscr1 | 17520 | -0.362 | -0.2580 | Yes |
| 76 | Ifit3 | 17617 | -0.369 | -0.2453 | Yes |
| 77 | B2m | 17707 | -0.376 | -0.2320 | Yes |
| 78 | Psma3 | 17809 | -0.385 | -0.2188 | Yes |
| 79 | Parp12 | 17829 | -0.387 | -0.2014 | Yes |
| 80 | Il4ra | 18025 | -0.404 | -0.1922 | Yes |
| 81 | Ifi44 | 18245 | -0.430 | -0.1829 | Yes |
| 82 | Ifitm3 | 18505 | -0.459 | -0.1742 | Yes |
| 83 | Bst2 | 18578 | -0.467 | -0.1557 | Yes |
| 84 | Procr | 18809 | -0.499 | -0.1437 | Yes |
| 85 | Herc6 | 18871 | -0.509 | -0.1227 | Yes |
| 86 | Helz2 | 19094 | -0.554 | -0.1076 | Yes |
| 87 | Oas1a | 19396 | -0.638 | -0.0927 | Yes |
| 88 | Mx2 | 19419 | -0.649 | -0.0630 | Yes |
| 89 | Ifitm2 | 19655 | -0.789 | -0.0375 | Yes |
| 90 | Ifitm1 | 19721 | -0.913 | 0.0025 | Yes |