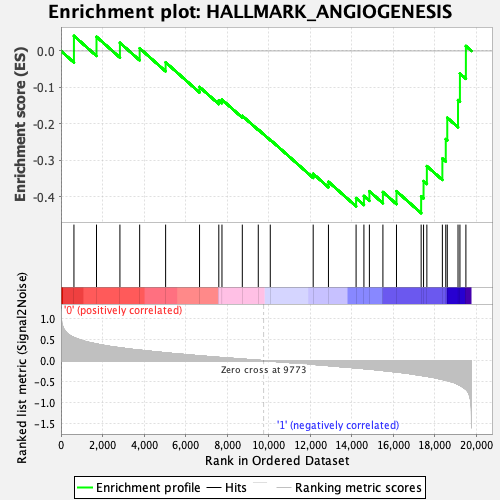
Profile of the Running ES Score & Positions of GeneSet Members on the Rank Ordered List
| Dataset | CMP.Basophil_Pheno.cls #Group1_versus_Group2.Basophil_Pheno.cls #Group1_versus_Group2_repos |
| Phenotype | Basophil_Pheno.cls#Group1_versus_Group2_repos |
| Upregulated in class | 1 |
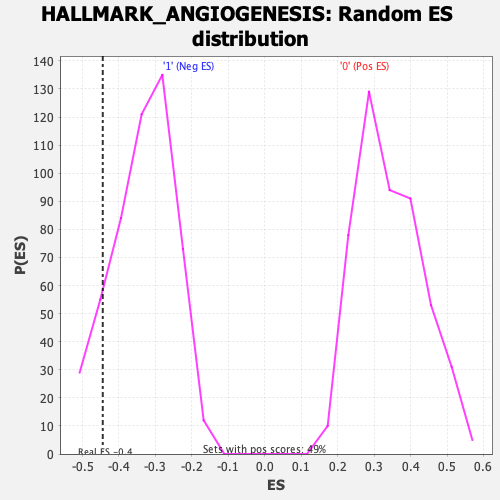
| GeneSet | HALLMARK_ANGIOGENESIS |
| Enrichment Score (ES) | -0.44452885 |
| Normalized Enrichment Score (NES) | -1.3338021 |
| Nominal p-value | 0.1237721 |
| FDR q-value | 0.25473025 |
| FWER p-Value | 0.719 |
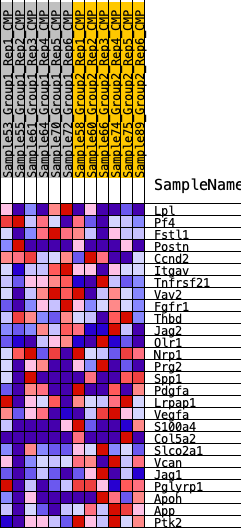
| SYMBOL | RANK IN GENE LIST | RANK METRIC SCORE | RUNNING ES | CORE ENRICHMENT | |
|---|---|---|---|---|---|
| 1 | Lpl | 623 | 0.550 | 0.0414 | No |
| 2 | Pf4 | 1710 | 0.396 | 0.0389 | No |
| 3 | Fstl1 | 2838 | 0.306 | 0.0224 | No |
| 4 | Postn | 3789 | 0.250 | 0.0074 | No |
| 5 | Ccnd2 | 5039 | 0.187 | -0.0311 | No |
| 6 | Itgav | 6673 | 0.114 | -0.0987 | No |
| 7 | Tnfrsf21 | 7601 | 0.078 | -0.1353 | No |
| 8 | Vav2 | 7753 | 0.073 | -0.1333 | No |
| 9 | Fgfr1 | 8733 | 0.038 | -0.1779 | No |
| 10 | Thbd | 9502 | 0.010 | -0.2154 | No |
| 11 | Jag2 | 10080 | -0.010 | -0.2434 | No |
| 12 | Olr1 | 12147 | -0.086 | -0.3366 | No |
| 13 | Nrp1 | 12882 | -0.115 | -0.3585 | No |
| 14 | Prg2 | 14213 | -0.171 | -0.4032 | Yes |
| 15 | Spp1 | 14590 | -0.187 | -0.3975 | Yes |
| 16 | Pdgfa | 14854 | -0.198 | -0.3845 | Yes |
| 17 | Lrpap1 | 15505 | -0.232 | -0.3867 | Yes |
| 18 | Vegfa | 16159 | -0.267 | -0.3844 | Yes |
| 19 | S100a4 | 17347 | -0.348 | -0.3984 | Yes |
| 20 | Col5a2 | 17463 | -0.358 | -0.3567 | Yes |
| 21 | Slco2a1 | 17622 | -0.370 | -0.3157 | Yes |
| 22 | Vcan | 18369 | -0.443 | -0.2947 | Yes |
| 23 | Jag1 | 18533 | -0.463 | -0.2416 | Yes |
| 24 | Pglyrp1 | 18605 | -0.470 | -0.1829 | Yes |
| 25 | Apoh | 19123 | -0.561 | -0.1347 | Yes |
| 26 | App | 19215 | -0.584 | -0.0619 | Yes |
| 27 | Ptk2 | 19502 | -0.679 | 0.0136 | Yes |