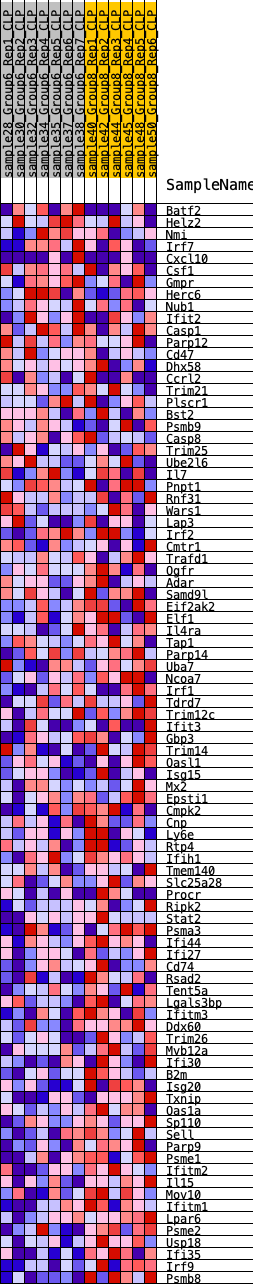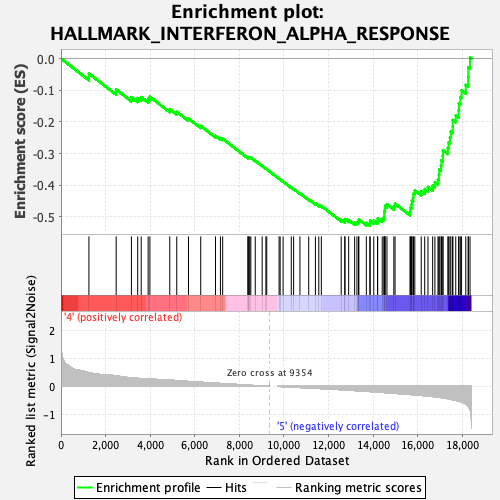
Profile of the Running ES Score & Positions of GeneSet Members on the Rank Ordered List
| Dataset | CLP.Basophil_Pheno.cls #Group6_versus_Group8.Basophil_Pheno.cls #Group6_versus_Group8_repos |
| Phenotype | Basophil_Pheno.cls#Group6_versus_Group8_repos |
| Upregulated in class | 5 |
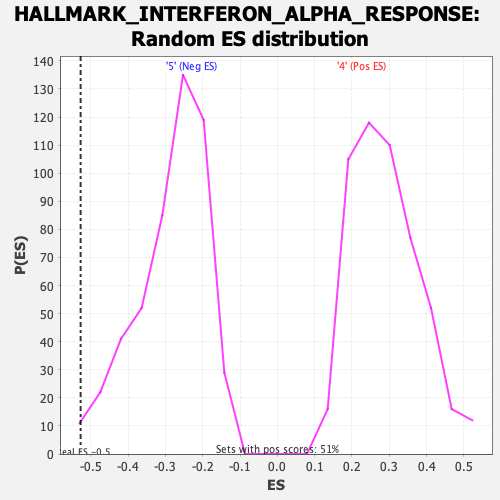
| GeneSet | HALLMARK_INTERFERON_ALPHA_RESPONSE |
| Enrichment Score (ES) | -0.5273641 |
| Normalized Enrichment Score (NES) | -1.8483478 |
| Nominal p-value | 0.0060728746 |
| FDR q-value | 0.057715517 |
| FWER p-Value | 0.024 |
| SYMBOL | RANK IN GENE LIST | RANK METRIC SCORE | RUNNING ES | CORE ENRICHMENT | |
|---|---|---|---|---|---|
| 1 | Batf2 | 1252 | 0.491 | -0.0473 | No |
| 2 | Helz2 | 2474 | 0.377 | -0.0977 | No |
| 3 | Nmi | 3158 | 0.305 | -0.1219 | No |
| 4 | Irf7 | 3440 | 0.287 | -0.1249 | No |
| 5 | Cxcl10 | 3597 | 0.276 | -0.1216 | No |
| 6 | Csf1 | 3908 | 0.259 | -0.1274 | No |
| 7 | Gmpr | 3987 | 0.254 | -0.1208 | No |
| 8 | Herc6 | 4878 | 0.224 | -0.1597 | No |
| 9 | Nub1 | 5191 | 0.203 | -0.1680 | No |
| 10 | Ifit2 | 5716 | 0.174 | -0.1891 | No |
| 11 | Casp1 | 6266 | 0.145 | -0.2129 | No |
| 12 | Parp12 | 6928 | 0.112 | -0.2442 | No |
| 13 | Cd47 | 7149 | 0.102 | -0.2518 | No |
| 14 | Dhx58 | 7250 | 0.096 | -0.2531 | No |
| 15 | Ccrl2 | 8382 | 0.043 | -0.3130 | No |
| 16 | Trim21 | 8393 | 0.043 | -0.3117 | No |
| 17 | Plscr1 | 8425 | 0.041 | -0.3116 | No |
| 18 | Bst2 | 8464 | 0.039 | -0.3120 | No |
| 19 | Psmb9 | 8512 | 0.037 | -0.3130 | No |
| 20 | Casp8 | 8711 | 0.028 | -0.3227 | No |
| 21 | Trim25 | 9022 | 0.015 | -0.3389 | No |
| 22 | Ube2l6 | 9188 | 0.008 | -0.3476 | No |
| 23 | Il7 | 9227 | 0.006 | -0.3494 | No |
| 24 | Pnpt1 | 9781 | -0.003 | -0.3794 | No |
| 25 | Rnf31 | 9827 | -0.005 | -0.3817 | No |
| 26 | Wars1 | 9961 | -0.010 | -0.3885 | No |
| 27 | Lap3 | 10327 | -0.025 | -0.4074 | No |
| 28 | Irf2 | 10432 | -0.030 | -0.4117 | No |
| 29 | Cmtr1 | 10715 | -0.041 | -0.4254 | No |
| 30 | Trafd1 | 11109 | -0.058 | -0.4443 | No |
| 31 | Ogfr | 11409 | -0.069 | -0.4577 | No |
| 32 | Adar | 11560 | -0.075 | -0.4626 | No |
| 33 | Samd9l | 11675 | -0.080 | -0.4654 | No |
| 34 | Eif2ak2 | 12565 | -0.121 | -0.5088 | No |
| 35 | Elf1 | 12726 | -0.128 | -0.5120 | No |
| 36 | Il4ra | 12735 | -0.128 | -0.5070 | No |
| 37 | Tap1 | 12900 | -0.136 | -0.5101 | No |
| 38 | Parp14 | 13169 | -0.150 | -0.5183 | No |
| 39 | Uba7 | 13272 | -0.155 | -0.5172 | No |
| 40 | Ncoa7 | 13342 | -0.159 | -0.5141 | No |
| 41 | Irf1 | 13359 | -0.160 | -0.5081 | No |
| 42 | Tdrd7 | 13693 | -0.177 | -0.5187 | No |
| 43 | Trim12c | 13853 | -0.186 | -0.5194 | Yes |
| 44 | Ifit3 | 13863 | -0.186 | -0.5119 | Yes |
| 45 | Gbp3 | 14027 | -0.194 | -0.5125 | Yes |
| 46 | Trim14 | 14193 | -0.203 | -0.5127 | Yes |
| 47 | Oasl1 | 14203 | -0.204 | -0.5045 | Yes |
| 48 | Isg15 | 14405 | -0.216 | -0.5062 | Yes |
| 49 | Mx2 | 14480 | -0.221 | -0.5008 | Yes |
| 50 | Epsti1 | 14501 | -0.222 | -0.4923 | Yes |
| 51 | Cmpk2 | 14502 | -0.222 | -0.4828 | Yes |
| 52 | Cnp | 14528 | -0.223 | -0.4746 | Yes |
| 53 | Ly6e | 14533 | -0.224 | -0.4652 | Yes |
| 54 | Rtp4 | 14617 | -0.229 | -0.4599 | Yes |
| 55 | Ifih1 | 14927 | -0.247 | -0.4661 | Yes |
| 56 | Tmem140 | 14981 | -0.251 | -0.4583 | Yes |
| 57 | Slc25a28 | 15652 | -0.291 | -0.4823 | Yes |
| 58 | Procr | 15671 | -0.293 | -0.4707 | Yes |
| 59 | Ripk2 | 15722 | -0.297 | -0.4607 | Yes |
| 60 | Stat2 | 15738 | -0.298 | -0.4488 | Yes |
| 61 | Psma3 | 15793 | -0.301 | -0.4388 | Yes |
| 62 | Ifi44 | 15805 | -0.302 | -0.4264 | Yes |
| 63 | Ifi27 | 15866 | -0.307 | -0.4165 | Yes |
| 64 | Cd74 | 16154 | -0.324 | -0.4183 | Yes |
| 65 | Rsad2 | 16310 | -0.335 | -0.4123 | Yes |
| 66 | Tent5a | 16457 | -0.345 | -0.4055 | Yes |
| 67 | Lgals3bp | 16667 | -0.364 | -0.4012 | Yes |
| 68 | Ifitm3 | 16768 | -0.376 | -0.3906 | Yes |
| 69 | Ddx60 | 16906 | -0.389 | -0.3814 | Yes |
| 70 | Trim26 | 16948 | -0.393 | -0.3667 | Yes |
| 71 | Mvb12a | 16960 | -0.393 | -0.3504 | Yes |
| 72 | Ifi30 | 17040 | -0.402 | -0.3375 | Yes |
| 73 | B2m | 17061 | -0.404 | -0.3212 | Yes |
| 74 | Isg20 | 17123 | -0.412 | -0.3069 | Yes |
| 75 | Txnip | 17131 | -0.413 | -0.2895 | Yes |
| 76 | Oas1a | 17348 | -0.443 | -0.2823 | Yes |
| 77 | Sp110 | 17385 | -0.448 | -0.2650 | Yes |
| 78 | Sell | 17444 | -0.457 | -0.2485 | Yes |
| 79 | Parp9 | 17484 | -0.464 | -0.2308 | Yes |
| 80 | Psme1 | 17566 | -0.480 | -0.2146 | Yes |
| 81 | Ifitm2 | 17570 | -0.480 | -0.1941 | Yes |
| 82 | Il15 | 17703 | -0.504 | -0.1797 | Yes |
| 83 | Mov10 | 17831 | -0.529 | -0.1639 | Yes |
| 84 | Ifitm1 | 17847 | -0.532 | -0.1418 | Yes |
| 85 | Lpar6 | 17909 | -0.551 | -0.1215 | Yes |
| 86 | Psme2 | 17964 | -0.566 | -0.1002 | Yes |
| 87 | Usp18 | 18153 | -0.633 | -0.0833 | Yes |
| 88 | Ifi35 | 18261 | -0.711 | -0.0586 | Yes |
| 89 | Irf9 | 18268 | -0.721 | -0.0279 | Yes |
| 90 | Psmb8 | 18343 | -0.827 | 0.0035 | Yes |