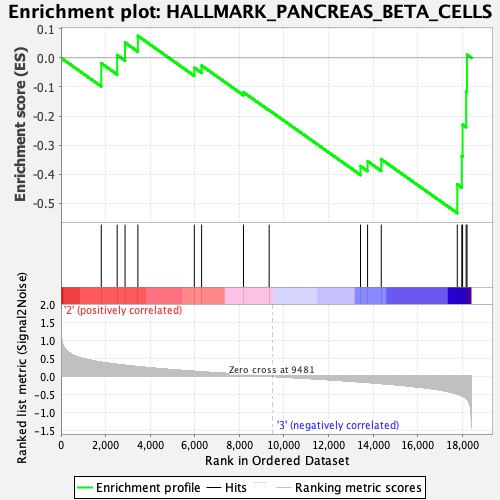
Profile of the Running ES Score & Positions of GeneSet Members on the Rank Ordered List
| Dataset | CLP.Basophil_Pheno.cls #Group3_versus_Group4.Basophil_Pheno.cls #Group3_versus_Group4_repos |
| Phenotype | Basophil_Pheno.cls#Group3_versus_Group4_repos |
| Upregulated in class | 3 |
| GeneSet | HALLMARK_PANCREAS_BETA_CELLS |
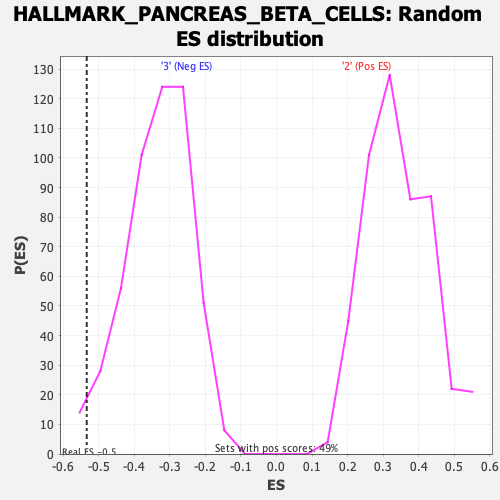
| Enrichment Score (ES) | -0.53369755 |
| Normalized Enrichment Score (NES) | -1.6016958 |
| Nominal p-value | 0.027667984 |
| FDR q-value | 0.31614947 |
| FWER p-Value | 0.275 |
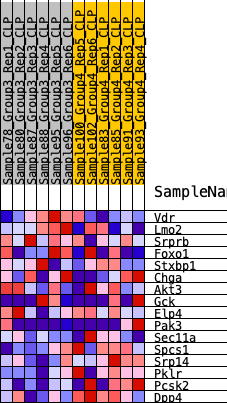
| SYMBOL | RANK IN GENE LIST | RANK METRIC SCORE | RUNNING ES | CORE ENRICHMENT | |
|---|---|---|---|---|---|
| 1 | Vdr | 1806 | 0.391 | -0.0187 | No |
| 2 | Lmo2 | 2519 | 0.330 | 0.0097 | No |
| 3 | Srprb | 2872 | 0.304 | 0.0525 | No |
| 4 | Foxo1 | 3448 | 0.267 | 0.0756 | No |
| 5 | Stxbp1 | 5979 | 0.138 | -0.0340 | No |
| 6 | Chga | 6305 | 0.124 | -0.0265 | No |
| 7 | Akt3 | 8184 | 0.050 | -0.1183 | No |
| 8 | Gck | 9335 | 0.005 | -0.1799 | No |
| 9 | Elp4 | 13432 | -0.151 | -0.3720 | No |
| 10 | Pak3 | 13749 | -0.166 | -0.3553 | No |
| 11 | Sec11a | 14362 | -0.197 | -0.3484 | No |
| 12 | Spcs1 | 17771 | -0.486 | -0.4348 | Yes |
| 13 | Srp14 | 17974 | -0.532 | -0.3376 | Yes |
| 14 | Pklr | 18010 | -0.541 | -0.2295 | Yes |
| 15 | Pcsk2 | 18168 | -0.604 | -0.1151 | Yes |
| 16 | Dpp4 | 18208 | -0.629 | 0.0109 | Yes |