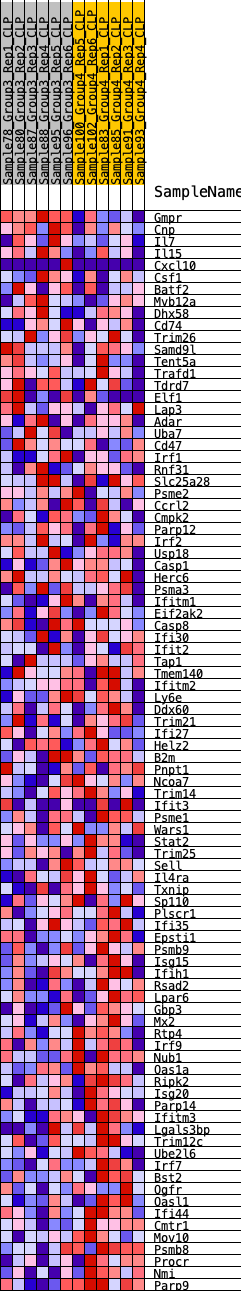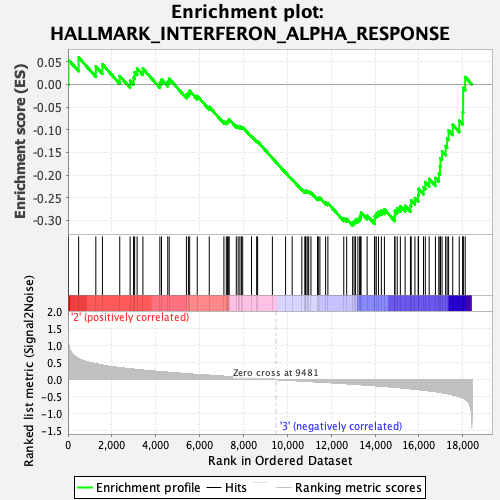
Profile of the Running ES Score & Positions of GeneSet Members on the Rank Ordered List
| Dataset | CLP.Basophil_Pheno.cls #Group3_versus_Group4.Basophil_Pheno.cls #Group3_versus_Group4_repos |
| Phenotype | Basophil_Pheno.cls#Group3_versus_Group4_repos |
| Upregulated in class | 3 |
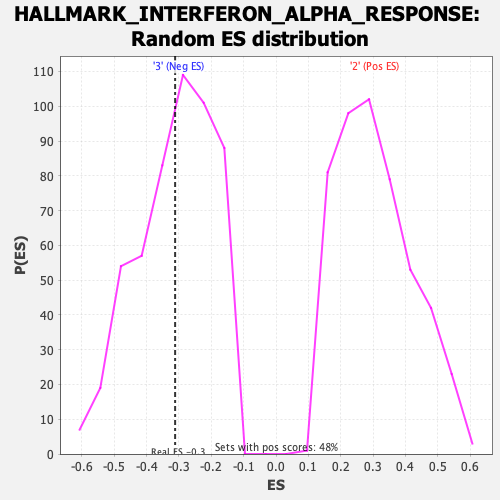
| GeneSet | HALLMARK_INTERFERON_ALPHA_RESPONSE |
| Enrichment Score (ES) | -0.31159648 |
| Normalized Enrichment Score (NES) | -0.9997451 |
| Nominal p-value | 0.45366797 |
| FDR q-value | 1.0 |
| FWER p-Value | 0.993 |
| SYMBOL | RANK IN GENE LIST | RANK METRIC SCORE | RUNNING ES | CORE ENRICHMENT | |
|---|---|---|---|---|---|
| 1 | Gmpr | 20 | 1.092 | 0.0542 | No |
| 2 | Cnp | 484 | 0.607 | 0.0596 | No |
| 3 | Il7 | 1268 | 0.451 | 0.0396 | No |
| 4 | Il15 | 1569 | 0.416 | 0.0443 | No |
| 5 | Cxcl10 | 2359 | 0.339 | 0.0184 | No |
| 6 | Csf1 | 2832 | 0.307 | 0.0082 | No |
| 7 | Batf2 | 2987 | 0.296 | 0.0147 | No |
| 8 | Mvb12a | 3038 | 0.295 | 0.0269 | No |
| 9 | Dhx58 | 3151 | 0.288 | 0.0354 | No |
| 10 | Cd74 | 3415 | 0.269 | 0.0346 | No |
| 11 | Trim26 | 4188 | 0.224 | 0.0038 | No |
| 12 | Samd9l | 4262 | 0.219 | 0.0109 | No |
| 13 | Tent5a | 4547 | 0.206 | 0.0058 | No |
| 14 | Trafd1 | 4613 | 0.202 | 0.0125 | No |
| 15 | Tdrd7 | 5398 | 0.163 | -0.0221 | No |
| 16 | Elf1 | 5488 | 0.159 | -0.0189 | No |
| 17 | Lap3 | 5546 | 0.156 | -0.0141 | No |
| 18 | Adar | 5891 | 0.142 | -0.0257 | No |
| 19 | Uba7 | 6439 | 0.118 | -0.0496 | No |
| 20 | Cd47 | 7107 | 0.089 | -0.0816 | No |
| 21 | Irf1 | 7217 | 0.087 | -0.0831 | No |
| 22 | Rnf31 | 7273 | 0.086 | -0.0818 | No |
| 23 | Slc25a28 | 7306 | 0.085 | -0.0792 | No |
| 24 | Psme2 | 7348 | 0.083 | -0.0773 | No |
| 25 | Ccrl2 | 7672 | 0.070 | -0.0914 | No |
| 26 | Cmpk2 | 7756 | 0.066 | -0.0926 | No |
| 27 | Parp12 | 7835 | 0.064 | -0.0936 | No |
| 28 | Irf2 | 7904 | 0.061 | -0.0942 | No |
| 29 | Usp18 | 7963 | 0.060 | -0.0944 | No |
| 30 | Casp1 | 8365 | 0.042 | -0.1141 | No |
| 31 | Herc6 | 8600 | 0.032 | -0.1253 | No |
| 32 | Psma3 | 8644 | 0.030 | -0.1261 | No |
| 33 | Ifitm1 | 9317 | 0.005 | -0.1625 | No |
| 34 | Eif2ak2 | 9919 | -0.014 | -0.1946 | No |
| 35 | Casp8 | 10219 | -0.024 | -0.2097 | No |
| 36 | Ifi30 | 10660 | -0.041 | -0.2316 | No |
| 37 | Ifit2 | 10796 | -0.046 | -0.2367 | No |
| 38 | Tap1 | 10831 | -0.047 | -0.2361 | No |
| 39 | Tmem140 | 10848 | -0.048 | -0.2346 | No |
| 40 | Ifitm2 | 10930 | -0.051 | -0.2364 | No |
| 41 | Ly6e | 10973 | -0.052 | -0.2361 | No |
| 42 | Ddx60 | 11076 | -0.055 | -0.2388 | No |
| 43 | Trim21 | 11374 | -0.067 | -0.2517 | No |
| 44 | Ifi27 | 11410 | -0.068 | -0.2502 | No |
| 45 | Helz2 | 11483 | -0.070 | -0.2506 | No |
| 46 | B2m | 11744 | -0.081 | -0.2607 | No |
| 47 | Pnpt1 | 11847 | -0.084 | -0.2620 | No |
| 48 | Ncoa7 | 12571 | -0.114 | -0.2957 | No |
| 49 | Trim14 | 12703 | -0.119 | -0.2968 | No |
| 50 | Ifit3 | 12975 | -0.131 | -0.3050 | Yes |
| 51 | Psme1 | 13043 | -0.134 | -0.3019 | Yes |
| 52 | Wars1 | 13108 | -0.137 | -0.2984 | Yes |
| 53 | Stat2 | 13215 | -0.142 | -0.2970 | Yes |
| 54 | Trim25 | 13293 | -0.145 | -0.2939 | Yes |
| 55 | Sell | 13337 | -0.147 | -0.2888 | Yes |
| 56 | Il4ra | 13358 | -0.148 | -0.2824 | Yes |
| 57 | Txnip | 13636 | -0.161 | -0.2894 | Yes |
| 58 | Sp110 | 13976 | -0.177 | -0.2990 | Yes |
| 59 | Plscr1 | 13986 | -0.177 | -0.2905 | Yes |
| 60 | Ifi35 | 14054 | -0.181 | -0.2850 | Yes |
| 61 | Epsti1 | 14154 | -0.186 | -0.2810 | Yes |
| 62 | Psmb9 | 14285 | -0.193 | -0.2783 | Yes |
| 63 | Isg15 | 14424 | -0.200 | -0.2757 | Yes |
| 64 | Ifih1 | 14897 | -0.224 | -0.2901 | Yes |
| 65 | Rsad2 | 14902 | -0.225 | -0.2790 | Yes |
| 66 | Lpar6 | 15008 | -0.231 | -0.2730 | Yes |
| 67 | Gbp3 | 15151 | -0.236 | -0.2688 | Yes |
| 68 | Mx2 | 15368 | -0.251 | -0.2679 | Yes |
| 69 | Rtp4 | 15610 | -0.267 | -0.2676 | Yes |
| 70 | Irf9 | 15645 | -0.270 | -0.2558 | Yes |
| 71 | Nub1 | 15815 | -0.280 | -0.2508 | Yes |
| 72 | Oas1a | 15963 | -0.291 | -0.2441 | Yes |
| 73 | Ripk2 | 15979 | -0.292 | -0.2302 | Yes |
| 74 | Isg20 | 16206 | -0.308 | -0.2269 | Yes |
| 75 | Parp14 | 16288 | -0.312 | -0.2155 | Yes |
| 76 | Ifitm3 | 16464 | -0.328 | -0.2085 | Yes |
| 77 | Lgals3bp | 16749 | -0.351 | -0.2063 | Yes |
| 78 | Trim12c | 16904 | -0.363 | -0.1963 | Yes |
| 79 | Ube2l6 | 16956 | -0.368 | -0.1805 | Yes |
| 80 | Irf7 | 16979 | -0.372 | -0.1629 | Yes |
| 81 | Bst2 | 17051 | -0.380 | -0.1475 | Yes |
| 82 | Ogfr | 17215 | -0.402 | -0.1361 | Yes |
| 83 | Oasl1 | 17283 | -0.410 | -0.1190 | Yes |
| 84 | Ifi44 | 17349 | -0.418 | -0.1014 | Yes |
| 85 | Cmtr1 | 17539 | -0.447 | -0.0891 | Yes |
| 86 | Mov10 | 17835 | -0.501 | -0.0799 | Yes |
| 87 | Psmb8 | 17992 | -0.536 | -0.0613 | Yes |
| 88 | Procr | 18012 | -0.541 | -0.0350 | Yes |
| 89 | Nmi | 18013 | -0.541 | -0.0076 | Yes |
| 90 | Parp9 | 18107 | -0.576 | 0.0164 | Yes |