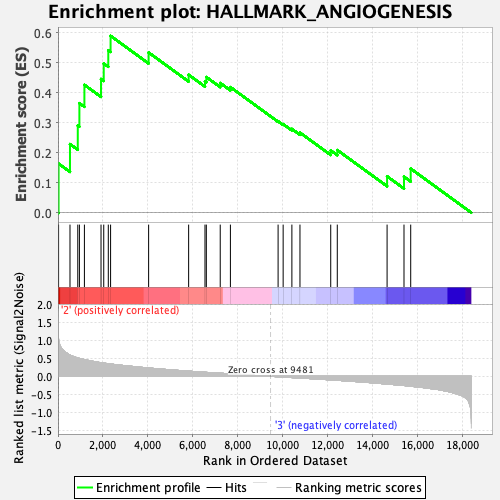
Profile of the Running ES Score & Positions of GeneSet Members on the Rank Ordered List
| Dataset | CLP.Basophil_Pheno.cls #Group3_versus_Group4.Basophil_Pheno.cls #Group3_versus_Group4_repos |
| Phenotype | Basophil_Pheno.cls#Group3_versus_Group4_repos |
| Upregulated in class | 2 |
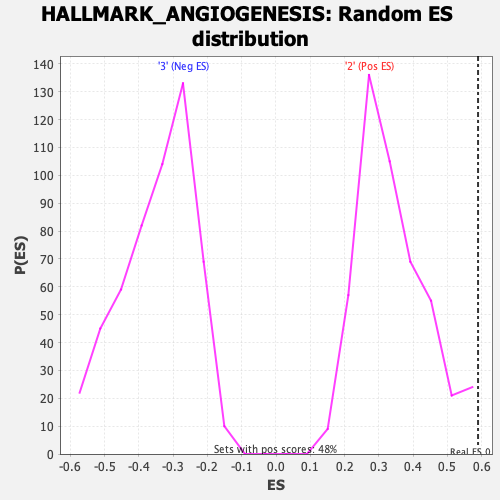
| GeneSet | HALLMARK_ANGIOGENESIS |
| Enrichment Score (ES) | 0.5892678 |
| Normalized Enrichment Score (NES) | 1.7416207 |
| Nominal p-value | 0.004201681 |
| FDR q-value | 0.16676952 |
| FWER p-Value | 0.105 |
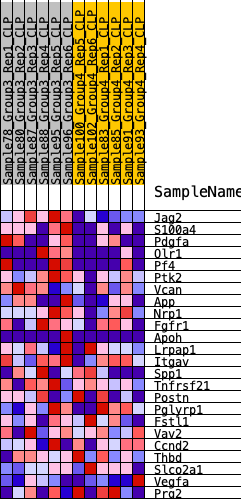
| SYMBOL | RANK IN GENE LIST | RANK METRIC SCORE | RUNNING ES | CORE ENRICHMENT | |
|---|---|---|---|---|---|
| 1 | Jag2 | 26 | 1.049 | 0.1635 | Yes |
| 2 | S100a4 | 534 | 0.589 | 0.2286 | Yes |
| 3 | Pdgfa | 881 | 0.513 | 0.2905 | Yes |
| 4 | Olr1 | 953 | 0.498 | 0.3649 | Yes |
| 5 | Pf4 | 1176 | 0.466 | 0.4261 | Yes |
| 6 | Ptk2 | 1916 | 0.379 | 0.4455 | Yes |
| 7 | Vcan | 2037 | 0.370 | 0.4972 | Yes |
| 8 | App | 2240 | 0.350 | 0.5413 | Yes |
| 9 | Nrp1 | 2342 | 0.340 | 0.5893 | Yes |
| 10 | Fgfr1 | 4036 | 0.233 | 0.5339 | No |
| 11 | Apoh | 5818 | 0.144 | 0.4597 | No |
| 12 | Lrpap1 | 6546 | 0.113 | 0.4379 | No |
| 13 | Itgav | 6606 | 0.111 | 0.4520 | No |
| 14 | Spp1 | 7225 | 0.087 | 0.4321 | No |
| 15 | Tnfrsf21 | 7678 | 0.069 | 0.4185 | No |
| 16 | Postn | 9802 | -0.010 | 0.3046 | No |
| 17 | Pglyrp1 | 10027 | -0.018 | 0.2952 | No |
| 18 | Fstl1 | 10416 | -0.032 | 0.2792 | No |
| 19 | Vav2 | 10776 | -0.045 | 0.2668 | No |
| 20 | Ccnd2 | 12146 | -0.096 | 0.2075 | No |
| 21 | Thbd | 12438 | -0.108 | 0.2087 | No |
| 22 | Slco2a1 | 14656 | -0.211 | 0.1213 | No |
| 23 | Vegfa | 15409 | -0.253 | 0.1201 | No |
| 24 | Prg2 | 15708 | -0.273 | 0.1469 | No |